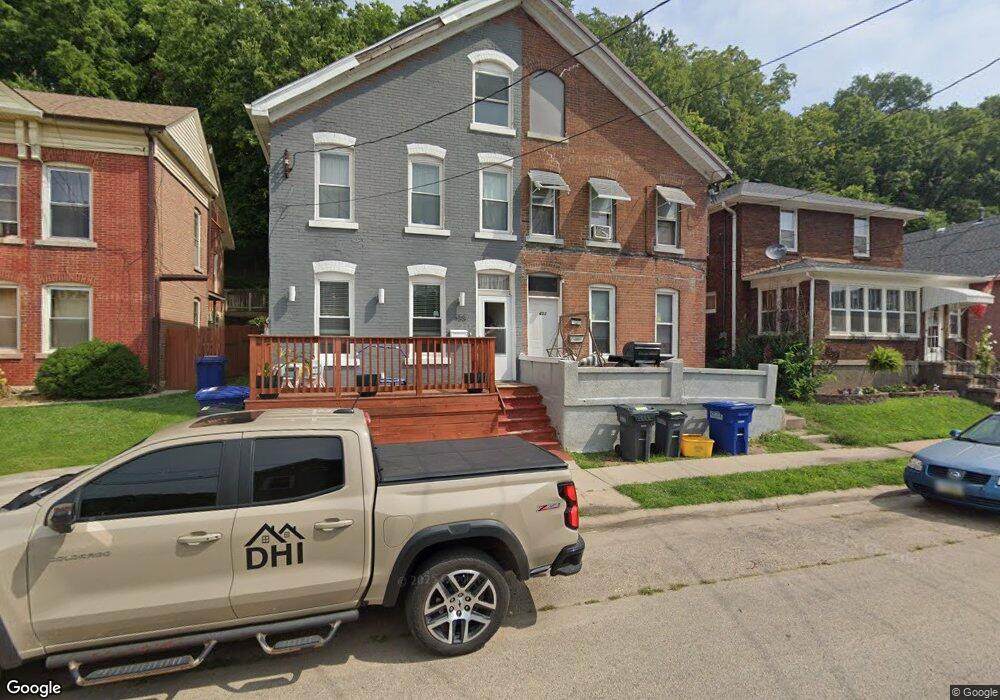
453 Almond St Dubuque, IA 52001
Estimated Value: $66,807 - $165,000
2
Beds
3
Baths
1,440
Sq Ft
$84/Sq Ft
Est. Value
About This Home
This home is located at 453 Almond St, Dubuque, IA 52001 and is currently estimated at $121,452, approximately $84 per square foot. 453 Almond St is a home located in Dubuque County with nearby schools including Prescott Elementary School, George Washington Middle School, and Dubuque Senior High School.
Ownership History
Date
Name
Owned For
Owner Type
Purchase Details
Closed on
Oct 3, 2018
Sold by
Red Owl Investments Llc
Bought by
Mid America Property Management Llc
Current Estimated Value
Home Financials for this Owner
Home Financials are based on the most recent Mortgage that was taken out on this home.
Original Mortgage
$2,530,281
Outstanding Balance
$2,202,010
Interest Rate
4.5%
Mortgage Type
Future Advance Clause Open End Mortgage
Estimated Equity
-$2,080,558
Purchase Details
Closed on
Jan 31, 2017
Sold by
Bon Vivant Lc
Bought by
Red Owl Investments Llc
Create a Home Valuation Report for This Property
The Home Valuation Report is an in-depth analysis detailing your home's value as well as a comparison with similar homes in the area
Home Values in the Area
Average Home Value in this Area
Purchase History
| Date | Buyer | Sale Price | Title Company |
|---|---|---|---|
| Mid America Property Management Llc | $28,000 | None Available | |
| Red Owl Investments Llc | -- | None Available |
Source: Public Records
Mortgage History
| Date | Status | Borrower | Loan Amount |
|---|---|---|---|
| Open | Mid America Property Management Llc | $2,530,281 |
Source: Public Records
Tax History Compared to Growth
Tax History
| Year | Tax Paid | Tax Assessment Tax Assessment Total Assessment is a certain percentage of the fair market value that is determined by local assessors to be the total taxable value of land and additions on the property. | Land | Improvement |
|---|---|---|---|---|
| 2025 | $510 | $40,900 | $7,200 | $33,700 |
| 2024 | $510 | $35,400 | $6,800 | $28,600 |
| 2023 | $494 | $35,400 | $6,800 | $28,600 |
| 2022 | $660 | $39,890 | $6,840 | $33,050 |
| 2021 | $660 | $39,890 | $6,840 | $33,050 |
| 2020 | $578 | $32,360 | $6,840 | $25,520 |
| 2019 | $664 | $32,550 | $6,840 | $25,710 |
| 2018 | $654 | $35,740 | $6,840 | $28,900 |
| 2017 | $906 | $35,740 | $6,840 | $28,900 |
| 2016 | $906 | $46,910 | $6,840 | $40,070 |
| 2015 | $888 | $46,910 | $6,840 | $40,070 |
| 2014 | $864 | $46,910 | $6,840 | $40,070 |
Source: Public Records
Map
Nearby Homes
- 455 Almond St
- 1951 Madison St
- 410 Unit B Clarke Dr
- 1906 Ellis St
- 2071 N Main St
- 1765 Madison St
- 1735 Madison St Unit 1737 & 1745 Madison
- 251 W 17th St Unit 253 West 17th St
- 364 W Locust St Unit 366 W Locust Street
- 601 Angella St
- 645 Angella St
- 340 Kaufmann Ave
- 337 Kaufmann Ave
- 1735 Central Ave
- 1477 Locust St
- 460 Loras Blvd
- 1930 Jackson St
- 568 Loras Blvd
- 1500 Central Ave
- 1830 Jackson St