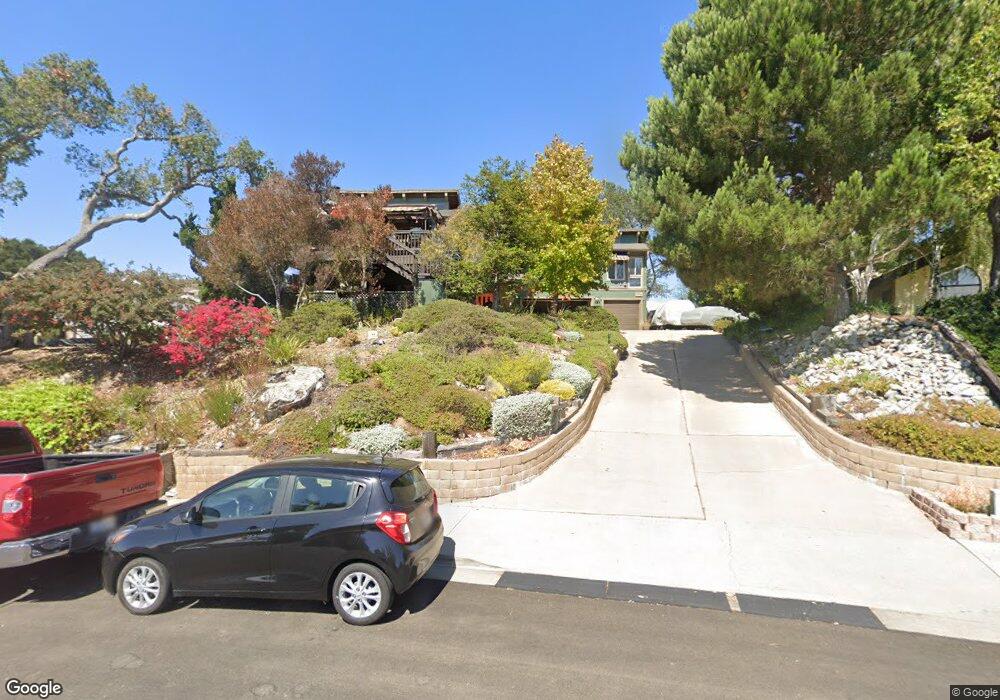
453 Campana Place Arroyo Grande, CA 93420
Estimated Value: $1,015,717 - $1,408,000
4
Beds
3
Baths
2,616
Sq Ft
$465/Sq Ft
Est. Value
About This Home
This home is located at 453 Campana Place, Arroyo Grande, CA 93420 and is currently estimated at $1,215,679, approximately $464 per square foot. 453 Campana Place is a home located in San Luis Obispo County with nearby schools including Ocean View Elementary School, Paulding Middle School, and Arroyo Grande High School.
Ownership History
Date
Name
Owned For
Owner Type
Purchase Details
Closed on
Apr 14, 2020
Sold by
Stckes Kent Aaron and Stckes Elena Florence
Bought by
Stckes Elena Florence and Stokes Kent Aaron
Current Estimated Value
Home Financials for this Owner
Home Financials are based on the most recent Mortgage that was taken out on this home.
Original Mortgage
$231,000
Interest Rate
3.6%
Mortgage Type
New Conventional
Purchase Details
Closed on
Feb 8, 2012
Sold by
Stokes Elena Florence and Stokes Kent Aaron
Bought by
Stokes Kent Aaron and Stokes Elena Florence
Home Financials for this Owner
Home Financials are based on the most recent Mortgage that was taken out on this home.
Original Mortgage
$201,000
Interest Rate
3.84%
Mortgage Type
New Conventional
Purchase Details
Closed on
Mar 2, 2007
Sold by
Stokes Kent A and Stokes Elena F
Bought by
Stokes Elena Florence and Stokes Kent Aaron
Create a Home Valuation Report for This Property
The Home Valuation Report is an in-depth analysis detailing your home's value as well as a comparison with similar homes in the area
Home Values in the Area
Average Home Value in this Area
Purchase History
| Date | Buyer | Sale Price | Title Company |
|---|---|---|---|
| Stckes Elena Florence | -- | Fidelity National Title Co | |
| Stokes Kent Aaron | -- | Fidelity National Title Co | |
| Stokes Kent Aaron | -- | First American Title Company | |
| Stokes Elena Florence | -- | First American Title Company | |
| Stokes Elena Florence | -- | None Available |
Source: Public Records
Mortgage History
| Date | Status | Borrower | Loan Amount |
|---|---|---|---|
| Closed | Stokes Kent Aaron | $231,000 | |
| Closed | Stokes Kent Aaron | $201,000 |
Source: Public Records
Tax History Compared to Growth
Tax History
| Year | Tax Paid | Tax Assessment Tax Assessment Total Assessment is a certain percentage of the fair market value that is determined by local assessors to be the total taxable value of land and additions on the property. | Land | Improvement |
|---|---|---|---|---|
| 2025 | $3,928 | $386,815 | $117,121 | $269,694 |
| 2024 | $3,881 | $379,231 | $114,825 | $264,406 |
| 2023 | $3,881 | $371,796 | $112,574 | $259,222 |
| 2022 | $3,821 | $364,507 | $110,367 | $254,140 |
| 2021 | $3,812 | $357,360 | $108,203 | $249,157 |
| 2020 | $3,768 | $353,697 | $107,094 | $246,603 |
| 2019 | $3,739 | $346,763 | $104,995 | $241,768 |
| 2018 | $3,693 | $339,965 | $102,937 | $237,028 |
| 2017 | $3,630 | $333,300 | $100,919 | $232,381 |
| 2016 | $3,428 | $326,766 | $98,941 | $227,825 |
| 2015 | $3,398 | $321,858 | $97,455 | $224,403 |
| 2014 | $3,274 | $315,554 | $95,546 | $220,008 |
Source: Public Records
Map
Nearby Homes
- 210 Acero Place
- 807 Plata Rd
- 1130 Vard Loomis Ln
- 950 Huasna Rd Unit 41
- 950 Huasna Rd Unit 20
- 555 Le Point St
- 547 May St
- 212 Miller Way
- 604 Hillside Ct
- 267 Mercedes Ln
- 324 Short St
- 289 Mercedes Ln
- 553 Rosemary Ln
- 649 Asilo
- 1155 Carpenter Canyon Rd
- 515 Windermere Ln
- 413 Via Bandolero
- 432 California St
- 1186 Ramblin Rose Way
- 411 Cornwall Ave
- 445 Campana Place
- 461 Campana Place
- 437 Campana Place
- 325 Acero Place
- 469 Campana Place
- 440 Campana Place
- 488 Cobre Place
- 477 Campana Place
- 429 Campana Place
- 468 Campana Place
- 460 Campana Place
- 420 Campana Place
- 315 Acero Place
- 487 Cobre Place
- 421 Campana Place
- 335 Acero Place
- 305 Acero Place
- 354 Corbett Canyon Rd
- 567 Gularte Rd