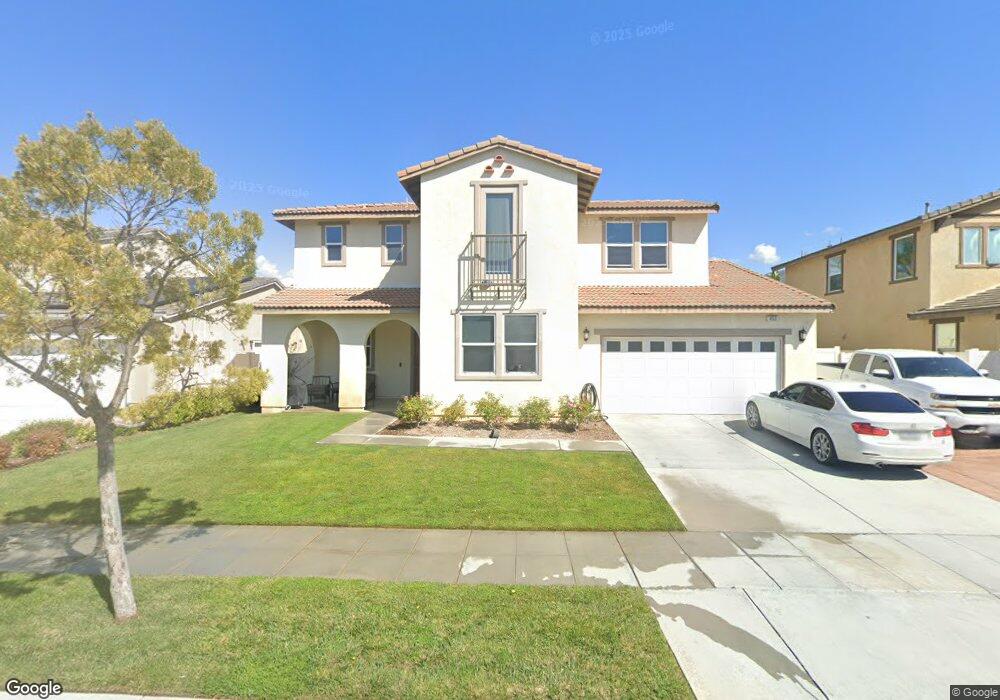
453 Edgewood Dr Fillmore, CA 93015
Estimated Value: $865,000 - $885,245
5
Beds
3
Baths
2,734
Sq Ft
$321/Sq Ft
Est. Value
About This Home
This home is located at 453 Edgewood Dr, Fillmore, CA 93015 and is currently estimated at $877,561, approximately $320 per square foot. 453 Edgewood Dr is a home located in Ventura County with nearby schools including Rio Vista Elementary School and Fillmore Senior High.
Ownership History
Date
Name
Owned For
Owner Type
Purchase Details
Closed on
May 26, 2016
Sold by
Riesenberger Stephen and Riesenberger Allana L
Bought by
Garcia Daniel C and Cabrera Sofia
Current Estimated Value
Home Financials for this Owner
Home Financials are based on the most recent Mortgage that was taken out on this home.
Original Mortgage
$400,000
Interest Rate
3.66%
Mortgage Type
New Conventional
Purchase Details
Closed on
Mar 17, 2015
Sold by
Wh Fillmore 51 Llc
Bought by
Riesenberger Stephen and Riesenberger Allana L
Home Financials for this Owner
Home Financials are based on the most recent Mortgage that was taken out on this home.
Original Mortgage
$455,173
Interest Rate
3.3%
Mortgage Type
FHA
Create a Home Valuation Report for This Property
The Home Valuation Report is an in-depth analysis detailing your home's value as well as a comparison with similar homes in the area
Home Values in the Area
Average Home Value in this Area
Purchase History
| Date | Buyer | Sale Price | Title Company |
|---|---|---|---|
| Garcia Daniel C | $500,000 | Fidelity National Title | |
| Riesenberger Stephen | $464,000 | Lawyers Title Company |
Source: Public Records
Mortgage History
| Date | Status | Borrower | Loan Amount |
|---|---|---|---|
| Previous Owner | Garcia Daniel C | $400,000 | |
| Previous Owner | Riesenberger Stephen | $455,173 |
Source: Public Records
Tax History
| Year | Tax Paid | Tax Assessment Tax Assessment Total Assessment is a certain percentage of the fair market value that is determined by local assessors to be the total taxable value of land and additions on the property. | Land | Improvement |
|---|---|---|---|---|
| 2025 | $11,073 | $580,288 | $377,189 | $203,099 |
| 2024 | $11,073 | $568,910 | $369,793 | $199,117 |
| 2023 | $10,923 | $557,755 | $362,542 | $195,213 |
| 2022 | $10,371 | $546,819 | $355,433 | $191,386 |
| 2021 | $11,257 | $536,098 | $348,464 | $187,634 |
| 2020 | $10,701 | $530,603 | $344,892 | $185,711 |
| 2019 | $10,643 | $520,200 | $338,130 | $182,070 |
| 2018 | $10,476 | $510,000 | $331,500 | $178,500 |
| 2017 | $10,493 | $500,000 | $325,000 | $175,000 |
| 2016 | $9,387 | $470,638 | $306,097 | $164,541 |
| 2015 | $8,370 | $407,098 | $104,098 | $303,000 |
| 2014 | $1,363 | $80,000 | $80,000 | $0 |
Source: Public Records
Map
Nearby Homes
- 458 Edgewood Dr
- 513 Heritage Valley Pkwy
- 534 Mulberry Ln
- 549 Heritage Valley Pkwy
- 309 Heritage Valley Pkwy
- 578 Apricot Ln
- 586 Apricot Ln
- 252 Driftwood St
- 199 Rosewood St
- 340 Central Ave
- 158 Arborwood St
- 404 Central Ave
- 444 Mountain View St
- 318 Bard St
- 126 Wisteria St
- 154 Azalea St
- 153 Heritage Valley Pkwy
- 250 E Telegraph Rd Unit 200
- 250 E Telegraph Rd Unit 68
- 250 E Telegraph Rd Unit 213
Your Personal Tour Guide
Ask me questions while you tour the home.