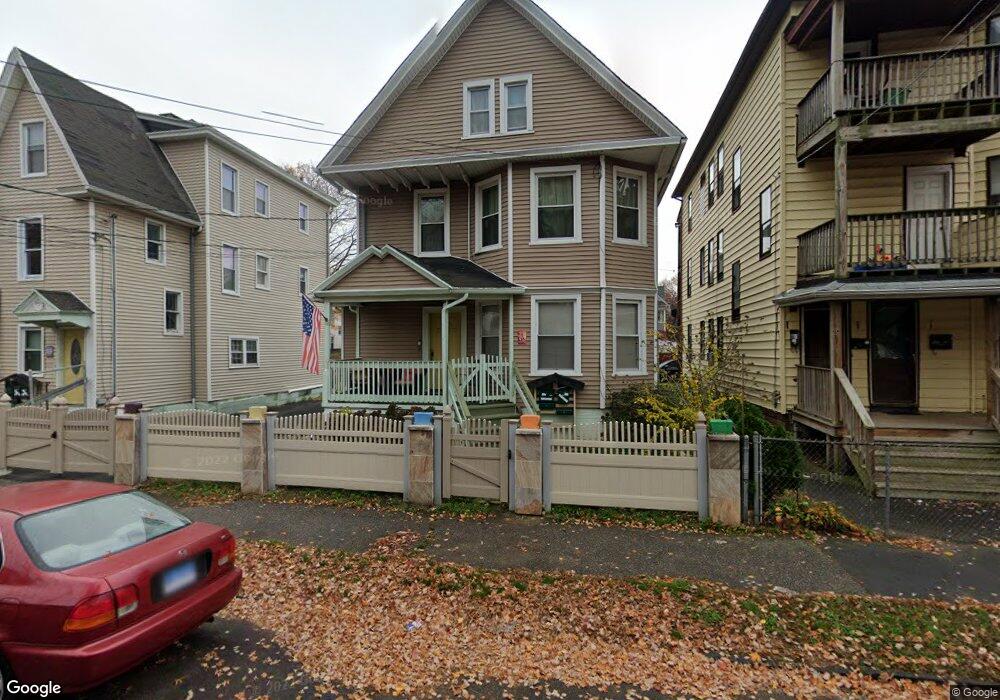
453 Maplewood Ave Bridgeport, CT 06605
West End-West Side NeighborhoodEstimated Value: $340,000 - $434,000
5
Beds
2
Baths
1,639
Sq Ft
$229/Sq Ft
Est. Value
About This Home
This home is located at 453 Maplewood Ave, Bridgeport, CT 06605 and is currently estimated at $375,777, approximately $229 per square foot. 453 Maplewood Ave is a home with nearby schools including James J. Curiale School and Bassick High School.
Ownership History
Date
Name
Owned For
Owner Type
Purchase Details
Closed on
Aug 12, 2024
Sold by
Clarke Peter
Bought by
Clarke Peter
Current Estimated Value
Purchase Details
Closed on
Jun 9, 2014
Sold by
Stokes Pamela
Bought by
Clarke Peter
Home Financials for this Owner
Home Financials are based on the most recent Mortgage that was taken out on this home.
Original Mortgage
$95,000
Interest Rate
4.33%
Mortgage Type
Commercial
Purchase Details
Closed on
Nov 15, 1989
Sold by
Schreier Ernest
Bought by
Stokes Garland
Home Financials for this Owner
Home Financials are based on the most recent Mortgage that was taken out on this home.
Original Mortgage
$165,000
Interest Rate
9.97%
Mortgage Type
Purchase Money Mortgage
Create a Home Valuation Report for This Property
The Home Valuation Report is an in-depth analysis detailing your home's value as well as a comparison with similar homes in the area
Home Values in the Area
Average Home Value in this Area
Purchase History
| Date | Buyer | Sale Price | Title Company |
|---|---|---|---|
| Clarke Peter | -- | None Available | |
| Clarke Peter | -- | None Available | |
| Clarke Peter | -- | None Available | |
| Clarke Peter | $150,000 | -- | |
| Clarke Peter | $150,000 | -- | |
| Stokes Garland | $150,000 | -- |
Source: Public Records
Mortgage History
| Date | Status | Borrower | Loan Amount |
|---|---|---|---|
| Previous Owner | Stokes Garland | $123,750 | |
| Previous Owner | Stokes Garland | $95,000 | |
| Previous Owner | Stokes Garland | $165,000 |
Source: Public Records
Tax History Compared to Growth
Tax History
| Year | Tax Paid | Tax Assessment Tax Assessment Total Assessment is a certain percentage of the fair market value that is determined by local assessors to be the total taxable value of land and additions on the property. | Land | Improvement |
|---|---|---|---|---|
| 2025 | $6,669 | $153,490 | $48,850 | $104,640 |
| 2024 | $6,669 | $153,490 | $48,850 | $104,640 |
| 2023 | $6,669 | $153,490 | $48,850 | $104,640 |
| 2022 | $6,669 | $153,490 | $48,850 | $104,640 |
| 2021 | $6,669 | $153,490 | $48,850 | $104,640 |
| 2020 | $5,415 | $100,290 | $20,360 | $79,930 |
| 2019 | $5,415 | $100,290 | $20,360 | $79,930 |
| 2018 | $5,453 | $100,290 | $20,360 | $79,930 |
| 2017 | $5,453 | $100,290 | $20,360 | $79,930 |
| 2016 | $5,453 | $100,290 | $20,360 | $79,930 |
| 2015 | $5,316 | $125,980 | $24,630 | $101,350 |
| 2014 | $5,316 | $125,980 | $24,630 | $101,350 |
Source: Public Records
Map
Nearby Homes
- 414 Wood Ave
- 700 Laurel Ave
- 697 Laurel Ave
- 566 Wood Ave
- 826 Norman St
- 670 Clinton Ave
- 393 Laurel Ave Unit 203
- 393 Laurel Ave Unit 415
- 687 Wood Ave
- 60 Olive St
- 533 Clinton Ave
- 1373 Iranistan Ave
- 1872 North Ave Unit 1874
- 184 Pacific St
- 468 Colorado Ave
- 592 Norman St Unit 594
- 212 Denver Ave
- 99 Denver Ave Unit 101
- 115 Denver Ave Unit 117
- 1199 Iranistan Ave Unit 1201
- 445 Maplewood Ave
- 435 Maplewood Ave Unit 437
- 435 Maplewood Ave Unit 2
- 461 Maplewood Ave Unit 465
- 80 Hazelwood Ave
- 58 Hazelwood Ave
- 467 Maplewood Ave
- 423 Maplewood Ave Unit 425
- 90 Hazelwood Ave
- 56 Hazelwood Ave
- 74 Hazelwood Ave Unit 76
- 74 Hazelwood Ave Unit 2
- 413 Maplewood Ave Unit 415
- 48 Hazelwood Ave
- 464 Maplewood Ave
- 407 Maplewood Ave Unit 409
- 470 Maplewood Ave
- 40 Hazelwood Ave
- 654 Laurel Ave Unit 656
- 61 Hazelwood Ave Unit 63