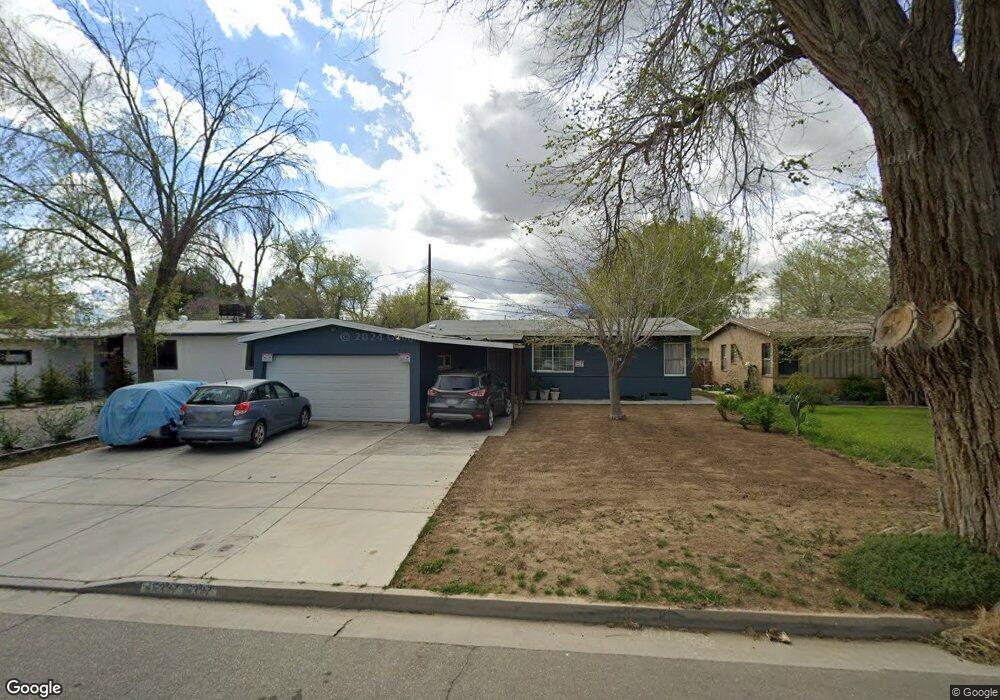
45327 11th St W Lancaster, CA 93534
Central Lancaster NeighborhoodEstimated Value: $299,000 - $366,000
3
Beds
1
Bath
1,010
Sq Ft
$331/Sq Ft
Est. Value
About This Home
This home is located at 45327 11th St W, Lancaster, CA 93534 and is currently estimated at $333,993, approximately $330 per square foot. 45327 11th St W is a home located in Los Angeles County with nearby schools including Desert View Elementary School, Piute Middle School, and Antelope Valley High School.
Ownership History
Date
Name
Owned For
Owner Type
Purchase Details
Closed on
Jun 1, 2011
Sold by
The Secretary Of Housing & Urban Develop
Bought by
Martinez Jose O and Ramirez Francisca
Current Estimated Value
Purchase Details
Closed on
Dec 30, 2010
Sold by
Wells Fargo Bank Na
Bought by
Secretary Of The Department Of Housing &
Purchase Details
Closed on
Oct 19, 2010
Sold by
Williams Isaac
Bought by
Wells Fargo Bank Na
Purchase Details
Closed on
Oct 1, 2009
Sold by
Green Lee C and Green Judy C
Bought by
Green Sharae D
Purchase Details
Closed on
Mar 29, 2007
Sold by
Green Judy C
Bought by
Green Lee and Green Judy C
Purchase Details
Closed on
Jul 9, 2002
Sold by
Williams Isaac
Bought by
Green Judy C
Purchase Details
Closed on
Mar 13, 2002
Sold by
Hands David and Hands Lori J
Bought by
Williams Isaac
Home Financials for this Owner
Home Financials are based on the most recent Mortgage that was taken out on this home.
Original Mortgage
$86,049
Interest Rate
7.08%
Mortgage Type
FHA
Create a Home Valuation Report for This Property
The Home Valuation Report is an in-depth analysis detailing your home's value as well as a comparison with similar homes in the area
Home Values in the Area
Average Home Value in this Area
Purchase History
| Date | Buyer | Sale Price | Title Company |
|---|---|---|---|
| Martinez Jose O | $64,000 | Pacific Coast Title Company | |
| Secretary Of The Department Of Housing & | -- | First American | |
| Wells Fargo Bank Na | $94,329 | Accommodation | |
| Green Sharae D | -- | None Available | |
| Green Lee | -- | None Available | |
| Green Judy C | -- | -- | |
| Williams Isaac | $87,500 | First American Title Co |
Source: Public Records
Mortgage History
| Date | Status | Borrower | Loan Amount |
|---|---|---|---|
| Previous Owner | Williams Isaac | $86,049 |
Source: Public Records
Tax History
| Year | Tax Paid | Tax Assessment Tax Assessment Total Assessment is a certain percentage of the fair market value that is determined by local assessors to be the total taxable value of land and additions on the property. | Land | Improvement |
|---|---|---|---|---|
| 2025 | $2,319 | $81,855 | $16,393 | $65,462 |
| 2024 | $2,319 | $80,251 | $16,072 | $64,179 |
| 2023 | $2,274 | $78,678 | $15,757 | $62,921 |
| 2022 | $2,105 | $77,137 | $15,449 | $61,688 |
| 2021 | $1,737 | $75,626 | $15,147 | $60,479 |
| 2019 | $1,697 | $73,385 | $14,699 | $58,686 |
| 2018 | $1,670 | $71,947 | $14,411 | $57,536 |
| 2016 | $1,595 | $69,154 | $13,852 | $55,302 |
| 2015 | $1,580 | $68,116 | $13,644 | $54,472 |
| 2014 | $1,593 | $66,782 | $13,377 | $53,405 |
Source: Public Records
Map
Nearby Homes
- 106 W Avenue I
- 1011 W Avenue h12
- 45417 11th St W
- 1238 W Avenue h15
- 45318 Gadsden Ave
- 1149 W Avenue h11
- 0 Cor Avenue I Fern Ave
- 1329 Indian Sage Rd
- 750 Avenue H-12
- 45428 13th St W
- 723 W Avenue I
- 719 W Avenue h13
- 45517 Kingtree Ave
- 1342 W Avenue h15
- 45015 11th St W
- 1238 W H15
- 45504 Gadsden Ave
- 1380 Indian Sage Rd
- 1357 Boyden Ave
- 1408 W Avenue h15
- 45321 11th St W
- 45333 11th St W
- 45326 Kingtree Ave
- 45320 Kingtree Ave
- 45339 11th St W
- 45315 11th St W
- 45339 11th St W
- 45332 Kingtree Ave
- 45314 Kingtree Ave
- 45326 11th St W
- 45338 Kingtree Ave
- 45320 11th St W
- 45332 11th St W
- 45345 11th St W
- 45308 Kingtree Ave
- 45314 11th St W
- 45340 11th St W
- 45344 Kingtree Ave
- 45303 11th St W
- 45308 11th St W
Your Personal Tour Guide
Ask me questions while you tour the home.