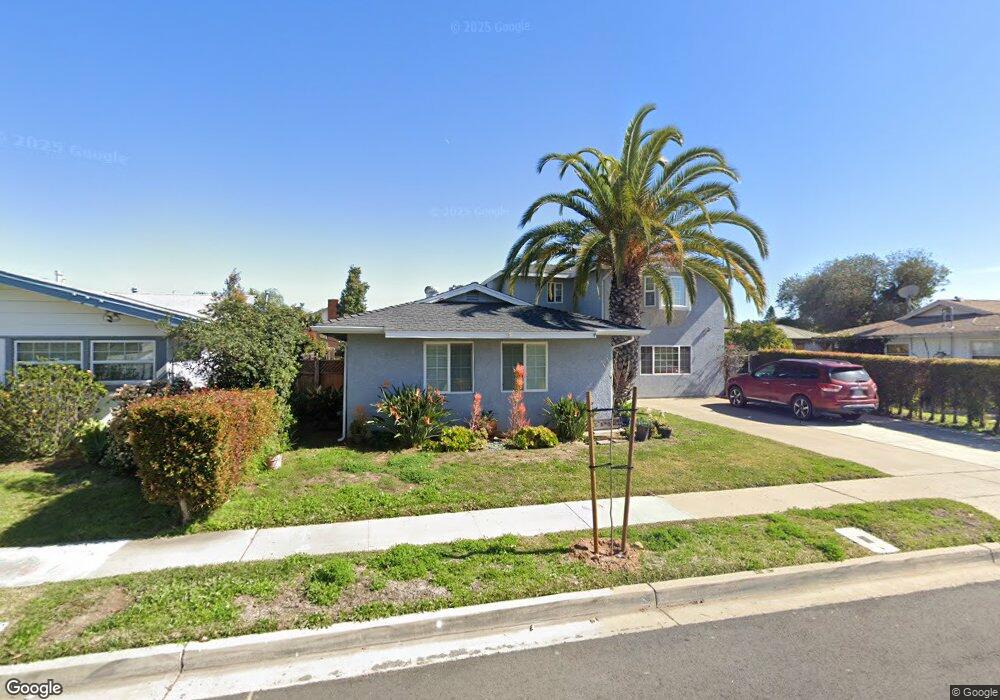
4533 Kamloop Ave San Diego, CA 92117
Bay Ho NeighborhoodEstimated Value: $1,377,000 - $1,441,000
4
Beds
3
Baths
1,904
Sq Ft
$736/Sq Ft
Est. Value
About This Home
This home is located at 4533 Kamloop Ave, San Diego, CA 92117 and is currently estimated at $1,401,445, approximately $736 per square foot. 4533 Kamloop Ave is a home located in San Diego County with nearby schools including Cadman Elementary School, Marston Middle School, and Clairemont High School.
Ownership History
Date
Name
Owned For
Owner Type
Purchase Details
Closed on
Mar 10, 2010
Sold by
Garcia F Michael
Bought by
Garcia Francisco Michael
Current Estimated Value
Home Financials for this Owner
Home Financials are based on the most recent Mortgage that was taken out on this home.
Original Mortgage
$303,000
Outstanding Balance
$96,100
Interest Rate
4.93%
Mortgage Type
New Conventional
Estimated Equity
$1,305,345
Purchase Details
Closed on
Dec 26, 2001
Sold by
Garcia Tisha Ann
Bought by
Garcia F Michael
Purchase Details
Closed on
Oct 21, 1999
Sold by
Debaca Arturo E C and Debaca Gloria M
Bought by
Garcia F Michael
Home Financials for this Owner
Home Financials are based on the most recent Mortgage that was taken out on this home.
Original Mortgage
$227,500
Interest Rate
7.84%
Create a Home Valuation Report for This Property
The Home Valuation Report is an in-depth analysis detailing your home's value as well as a comparison with similar homes in the area
Home Values in the Area
Average Home Value in this Area
Purchase History
| Date | Buyer | Sale Price | Title Company |
|---|---|---|---|
| Garcia Francisco Michael | -- | Ticor Title San Diego Branch | |
| Garcia F Michael | -- | Chicago Title Co | |
| Garcia F Michael | $239,500 | Lawyers Title |
Source: Public Records
Mortgage History
| Date | Status | Borrower | Loan Amount |
|---|---|---|---|
| Open | Garcia Francisco Michael | $303,000 | |
| Closed | Garcia F Michael | $227,500 |
Source: Public Records
Tax History
| Year | Tax Paid | Tax Assessment Tax Assessment Total Assessment is a certain percentage of the fair market value that is determined by local assessors to be the total taxable value of land and additions on the property. | Land | Improvement |
|---|---|---|---|---|
| 2025 | $5,665 | $474,721 | $215,170 | $259,551 |
| 2024 | $5,665 | $465,413 | $210,951 | $254,462 |
| 2023 | $5,538 | $456,288 | $206,815 | $249,473 |
| 2022 | $5,389 | $447,342 | $202,760 | $244,582 |
| 2021 | $5,351 | $438,572 | $198,785 | $239,787 |
| 2020 | $5,285 | $434,076 | $196,747 | $237,329 |
| 2019 | $5,190 | $425,566 | $192,890 | $232,676 |
| 2018 | $4,851 | $417,222 | $189,108 | $228,114 |
| 2017 | $4,734 | $409,042 | $185,400 | $223,642 |
| 2016 | $4,657 | $401,022 | $181,765 | $219,257 |
| 2015 | $4,587 | $394,999 | $179,035 | $215,964 |
| 2014 | $4,514 | $387,262 | $175,528 | $211,734 |
Source: Public Records
Map
Nearby Homes
- 3355 Hopi Place
- 4505 Moraga Ave
- 4454 Caminito Pedernal
- 3346-48 Luna Ave
- 3315 Moccasin Ave
- 3112 Luna Ave
- 4716 Murat Place
- 4657 Pocahontas Ave
- 4646 Coconino Way
- 3294 Atari Ct
- 4410 Gila Ave
- 4694 Leathers St
- 4064 Huerfano Ave Unit 249
- 4060 Huerfano Ave
- 4060 Huerfano Ave Unit 130
- 4984 Gaylord Dr
- 4976 Arroyo Lindo Ave
- 3861 Hiawatha Way
- 3642 Conrad Ave
- 2868 Wyandotte Ave
- 4529 Kamloop Ave
- 4537 Kamloop Ave
- 4530 La Crosse Ave
- 4534 La Crosse Ave
- 4525 Kamloop Ave
- 4541 Kamloop Ave
- 4524 La Crosse Ave
- 4540 La Crosse Ave
- 4534 Kamloop Ave
- 4538 Kamloop Ave
- 4530 Kamloop Ave
- 4519 Kamloop Ave
- 4518 La Crosse Ave
- 4542 Kamloop Ave
- 3345 Hopi Place
- 3337 Hopi Place
- 4524 Kamloop Ave
- 3365 Hopi Place
- 4512 La Crosse Ave
- 4539 Jicarillo Ave
Your Personal Tour Guide
Ask me questions while you tour the home.