4536 Fern Dr Unit 15 Bradenton, FL 34208
East Bradenton NeighborhoodEstimated Value: $289,895 - $305,000
3
Beds
2
Baths
2,120
Sq Ft
$140/Sq Ft
Est. Value
About This Home
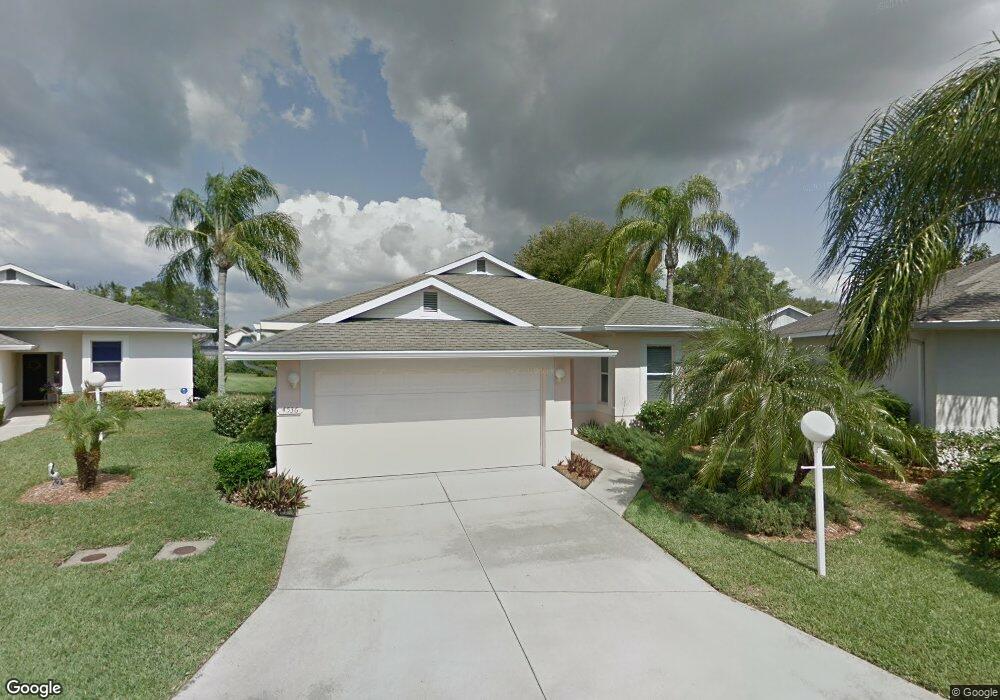
This home is located at 4536 Fern Dr Unit 15, Bradenton, FL 34208 and is currently estimated at $297,474, approximately $140 per square foot. 4536 Fern Dr Unit 15 is a home located in Manatee County with nearby schools including William H. Bashaw Elementary School, Carlos E. Haile Middle School, and Braden River High School.
Ownership History
Date
Name
Owned For
Owner Type
Purchase Details
Closed on
Mar 12, 2024
Sold by
Edwards Gary Dale and Edwards Pamela Ann
Bought by
Gary And Pamela Edwards Trust and Edwards
Current Estimated Value
Purchase Details
Closed on
Sep 13, 2001
Sold by
Storch Edmond C and Storch Janet E
Bought by
Edwards Gary Dale and Edwards Pamela Ann
Home Financials for this Owner
Home Financials are based on the most recent Mortgage that was taken out on this home.
Original Mortgage
$108,000
Interest Rate
6.98%
Mortgage Type
Purchase Money Mortgage
Purchase Details
Closed on
May 30, 1996
Sold by
Oakwood Land Assoc
Bought by
Storch Edmond C and Storch Janet E
Home Financials for this Owner
Home Financials are based on the most recent Mortgage that was taken out on this home.
Original Mortgage
$85,550
Interest Rate
7.93%
Mortgage Type
Purchase Money Mortgage
Create a Home Valuation Report for This Property
The Home Valuation Report is an in-depth analysis detailing your home's value as well as a comparison with similar homes in the area
Home Values in the Area
Average Home Value in this Area
Purchase History
| Date | Buyer | Sale Price | Title Company |
|---|---|---|---|
| Gary And Pamela Edwards Trust | $100 | None Listed On Document | |
| Edwards Gary Dale | $135,900 | -- | |
| Storch Edmond C | $107,000 | -- |
Source: Public Records
Mortgage History
| Date | Status | Borrower | Loan Amount |
|---|---|---|---|
| Previous Owner | Edwards Gary Dale | $108,000 | |
| Previous Owner | Storch Edmond C | $85,550 |
Source: Public Records
Tax History Compared to Growth
Tax History
| Year | Tax Paid | Tax Assessment Tax Assessment Total Assessment is a certain percentage of the fair market value that is determined by local assessors to be the total taxable value of land and additions on the property. | Land | Improvement |
|---|---|---|---|---|
| 2025 | $4,977 | $277,841 | -- | -- |
| 2024 | $4,977 | $302,052 | $35,700 | $266,352 |
| 2023 | $4,817 | $305,082 | $35,700 | $269,382 |
| 2022 | $4,358 | $267,026 | $35,000 | $232,026 |
| 2021 | $3,580 | $189,769 | $35,000 | $154,769 |
| 2020 | $3,638 | $184,049 | $35,000 | $149,049 |
| 2019 | $3,472 | $174,077 | $29,000 | $145,077 |
| 2018 | $3,300 | $164,655 | $25,000 | $139,655 |
| 2017 | $2,881 | $148,347 | $0 | $0 |
| 2016 | $2,771 | $140,250 | $0 | $0 |
| 2015 | $2,612 | $132,370 | $0 | $0 |
| 2014 | $2,612 | $129,089 | $0 | $0 |
| 2013 | $2,797 | $136,743 | $18,315 | $118,428 |
Source: Public Records
Map
Nearby Homes
- 4532 Fern Dr
- 4414 Spicewood Dr Unit C
- 1325 Bottlebrush Dr
- 1320 Bottlebrush Dr
- 1511 S Knollwood Dr
- 709 47th St E
- 1002 Oakleaf Blvd
- 4612 4th Ave E
- 4203 Neil Ln
- 1002 Pussywillow Ln
- 4003 Joyce Dr
- 3995 Lakewood Ave
- 4412 11th Ave E
- 916 48th Street Dr E
- 4304 14th Ave E
- 4603 3rd Ave E
- 202 Americas Cup Blvd
- 3906 Chinaberry Rd
- 4623 3rd Ave E
- 4427 Shark Dr
- 4538 Fern Dr
- 604 44th Street Ct E
- 4540 Fern Dr
- 606 44th Street Ct E
- 4535 Fern Dr
- 602 44th Street Ct E
- 4530 Fern Dr
- 4542 Fern Dr
- 4542 Fern Dr
- 608 44th Street Ct E
- 4529 Fern Dr
- 4541 Fern Dr Unit 17
- 4544 Fern Dr
- 4543 Fern Dr Unit 22
- 605 44th Street Ct E
- 610 44th Street Ct E
- 4443 6th Ave E
- 4526 Fern Dr Unit 10
- 4546 Fern Dr Unit 20
- 4750 E State Road 64