
Seller's Agent in 2022
Karine Loobas
Weichert REALTORS Tower Properties
(651) 303-7306
80 Total Sales
Estimated Value: $376,000 - $380,000
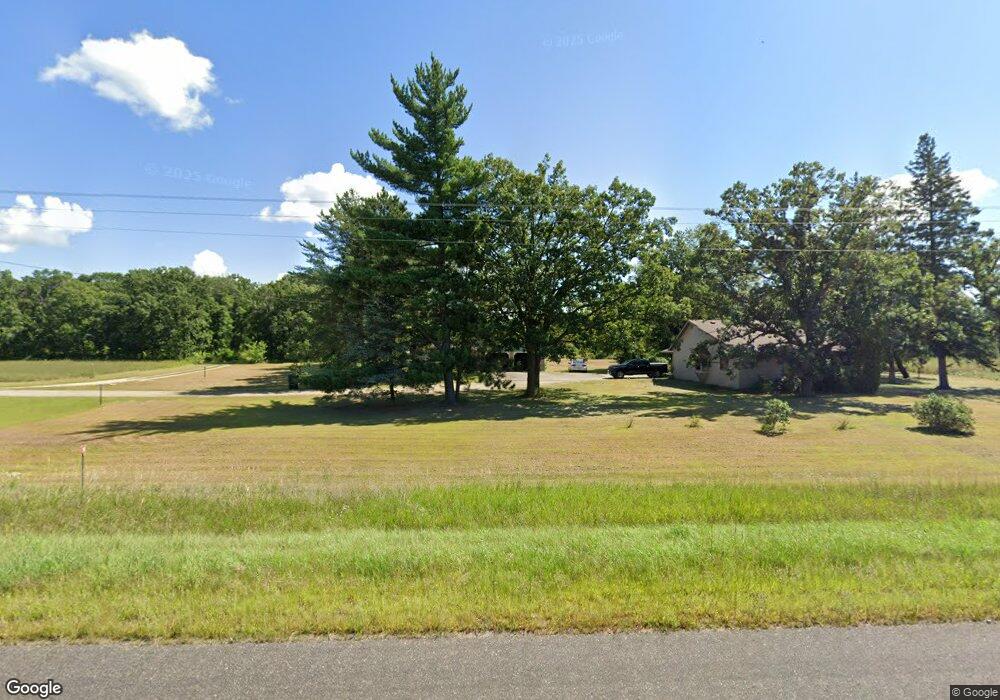
ONE-LEVEL LIVING WITH ACREAGE AND SEVERAL OUT BUILDINGS! This 1,952 sq.ft. home on over 9 acres offers 4 bedrooms on main and 5th bedroom on lower level, spacious kitchen-dining area, laundry on main, sky lights in living room and kitchen, vaulted ceilings in two of the bedrooms, abundant amount of storage throughout the home. Newer steel siding and roof on the house, newer roof on garages (except shed), newer furnace as well. Several out buildings include: 24x40 garage, 12x20 garage, 32x32 pole building and 16x32 WWII Shed converted into year-round "Man Cave" - something you must see in person! Fiber optic available if you work from home.
| Date | Buyer | Sale Price | Title Company |
|---|---|---|---|
| Cutler Jared | -- | -- | |
| Cutler Jared | -- | -- | |
| Cutler Jared | -- | -- | |
| Mankowski Steven L | $125,000 | -- |
| Date | Event | Price | List to Sale | Price per Sq Ft | Prior Sale |
|---|---|---|---|---|---|
| 11/15/2022 11/15/22 | Sold | $290,000 | -3.3% | $149 / Sq Ft | View Prior Sale |
| 09/15/2022 09/15/22 | Pending | -- | -- | -- | |
| 09/15/2022 09/15/22 | For Sale | $300,000 | -- | $154 / Sq Ft |
| Year | Tax Paid | Tax Assessment Tax Assessment Total Assessment is a certain percentage of the fair market value that is determined by local assessors to be the total taxable value of land and additions on the property. | Land | Improvement |
|---|---|---|---|---|
| 2025 | $1,492 | $361,400 | $110,800 | $250,600 |
| 2024 | $1,492 | $248,400 | $96,200 | $152,200 |
| 2023 | $1,254 | $223,100 | $69,400 | $153,700 |
| 2022 | $1,344 | $203,600 | $59,800 | $143,800 |
| 2021 | $1,350 | $172,900 | $61,100 | $111,800 |
| 2020 | $1,206 | $167,300 | $57,500 | $109,800 |
| 2019 | $1,180 | $154,800 | $54,100 | $100,700 |
| 2018 | $1,008 | $150,500 | $54,300 | $96,200 |
| 2017 | $876 | $122,009 | $43,927 | $78,082 |
| 2016 | $890 | $96,700 | $33,500 | $63,200 |
| 2015 | $920 | $97,000 | $33,600 | $63,400 |
| 2014 | $436 | $93,900 | $33,300 | $60,600 |
Seller's Agent in 2022
Karine Loobas
Weichert REALTORS Tower Properties
(651) 303-7306
80 Total Sales