454 1/2 Seminole Ct Grand Junction, CO 81504
Estimated payment $2,086/month
Highlights
- Very Popular Property
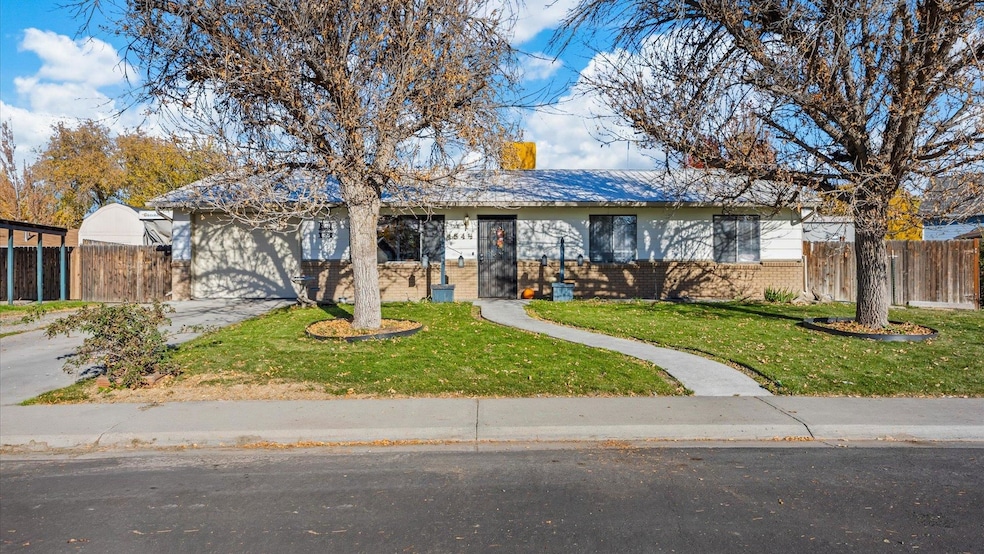
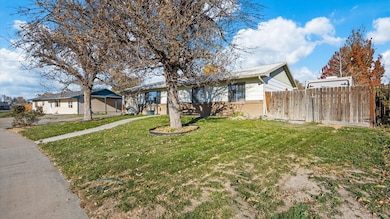
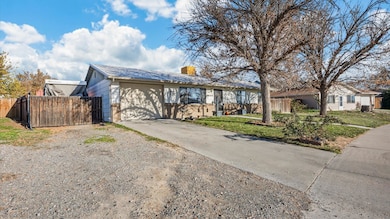
- Ranch Style House
- 1 Car Attached Garage
- Spa
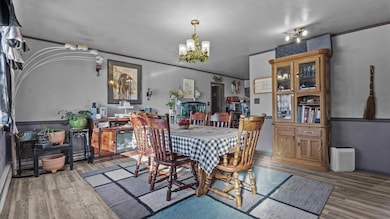
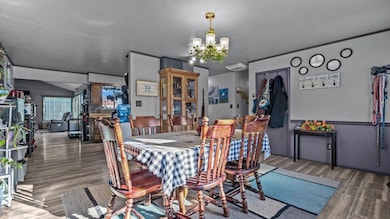
- Formal Dining Room
- Open Patio
About This Home
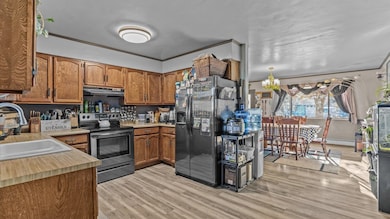
Welcome to this 4-bedroom, 2-bath home that brings together comfort, updates, and a large outdoor space of entertainment you’ll want to enjoy year-round. With over 1,500 sq ft and a smart layout, this property offers room to live, relax, and entertain. The fourth bedroom is non-conforming and located in the converted garage. One half serves as the fourth bedroom or your future flex space while the other half remains a spacious storage area — perfect for tools, seasonal gear, or hobby space. Prefer a full garage instead? The seller is willing to convert it back for you! Inside, the home features fresh flooring, updated paint throughout, and a large living room area complete with a fireplace and heated floors — a huge bonus on chilly Colorado mornings. Step outside and you’ll immediately see another reason this home stands out. A durable metal roof adds long-term peace of mind. The backyard includes a hot tub, a tranquil pond, a firepit area, two storage sheds, and a stone patio designed for entertainment. With plenty of space, RV parking, and no monthly HOA, you’re free to enjoy the property your way. If you’ve been looking for a move-in-ready home with character, updates, and an outdoor retreat built for Grand Junction, Colorado living, this one checks all the boxes. Reach out today for your private showing!
Listing Agent
REALTY ONE GROUP WESTERN SLOPE License #FA100092884 Listed on: 11/14/2025
Home Details
Home Type
- Single Family
Est. Annual Taxes
- $1,721
Year Built
- Built in 1981
Lot Details
- 9,583 Sq Ft Lot
- Lot Dimensions are 101.78x83.91
- Property is Fully Fenced
- Landscaped
HOA Fees
- $15 Monthly HOA Fees
Parking
- 1 Car Attached Garage
Home Design
- Ranch Style House
- Slab Foundation
- Wood Frame Construction
- Metal Roof
- Wood Siding
Interior Spaces
- 1,520 Sq Ft Home
- Ceiling Fan
- Gas Log Fireplace
- Living Room with Fireplace
- Formal Dining Room
- Luxury Vinyl Plank Tile Flooring
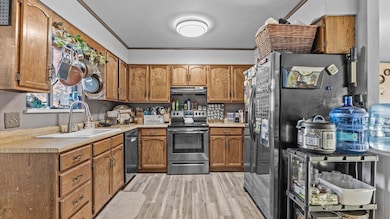
Kitchen
- Electric Oven or Range
- Dishwasher
- Disposal
Bedrooms and Bathrooms
- 4 Bedrooms
- 2 Bathrooms
Laundry
- Laundry on main level
- Dryer
- Washer
Outdoor Features
- Spa
- Open Patio
- Shed
Schools
- Pear Park Elementary School
- Grand Mesa Middle School
- Central High School
Utilities
- Evaporated cooling system
- Baseboard Heating
Community Details
- Cherokee Vil Subdivision
Listing and Financial Details
- Assessor Parcel Number 2943-161-55-004
Map
Home Values in the Area
Average Home Value in this Area
Tax History
| Year | Tax Paid | Tax Assessment Tax Assessment Total Assessment is a certain percentage of the fair market value that is determined by local assessors to be the total taxable value of land and additions on the property. | Land | Improvement |
|---|---|---|---|---|
| 2024 | $1,450 | $19,510 | $3,100 | $16,410 |
| 2023 | $1,450 | $19,510 | $3,100 | $16,410 |
| 2022 | $1,247 | $16,470 | $3,480 | $12,990 |
| 2021 | $1,252 | $16,940 | $3,580 | $13,360 |
| 2020 | $944 | $13,040 | $2,500 | $10,540 |
| 2019 | $895 | $13,040 | $2,500 | $10,540 |
| 2018 | $1,210 | $12,030 | $2,160 | $9,870 |
| 2017 | $781 | $12,030 | $2,160 | $9,870 |
| 2016 | $781 | $12,080 | $2,190 | $9,890 |
| 2015 | $792 | $12,080 | $2,190 | $9,890 |
| 2014 | $673 | $10,300 | $1,990 | $8,310 |
Property History
| Date | Event | Price | List to Sale | Price per Sq Ft |
|---|---|---|---|---|
| 11/14/2025 11/14/25 | For Sale | $365,000 | -- | $240 / Sq Ft |
Purchase History
| Date | Type | Sale Price | Title Company |
|---|---|---|---|
| Special Warranty Deed | $210,500 | Fidelity National Title | |
| Special Warranty Deed | $215,000 | Abstract & Title Co | |
| Warranty Deed | $165,500 | Fahtco |
Mortgage History
| Date | Status | Loan Amount | Loan Type |
|---|---|---|---|
| Open | $204,008 | FHA | |
| Previous Owner | $215,000 | Unknown |
Source: Grand Junction Area REALTOR® Association
MLS Number: 20255359
APN: 2943-161-55-004
Disclaimer: Certain information contained herein is derived from information provided by parties other than Homes.com. All information provided is deemed reliable, but is not guaranteed to be accurate and should be independently verified.
![]() IDX information is provided exclusively for personal, non-commercial use, and may not be used for any purpose other than to identify prospective properties consumers may be interested in purchasing.
IDX information is provided exclusively for personal, non-commercial use, and may not be used for any purpose other than to identify prospective properties consumers may be interested in purchasing.
Information is deemed reliable but not guaranteed.
- 3065 Cardinal Ct
- 3065 Thrush Dr
- 421 Pear Ln
- 423 Pear Ln
- 483 Jaquette Ln
- 486 Jaquette Ln
- 3084 Aberdeen Ln
- 3044 Hill Ave
- 3051 Hawkwood Ct
- 3023 Grand Meadow Ave
- 424 Steven Creek St
- 415 1/2 Chiswick Way
- 414 Lark Ct
- 412 Pear Meadows St
- 495 Mcmullin Dr
- 484 Sheldon Rd
- 3031 Red Pear Dr
- 3018 Hill Ct
- 3046 1/2 Wedgewood Dr
- 3025 Red Pear Dr
- 454 Lewis St
- 391 Sunnyside Cir
- 2929 Bunting Ave Unit 2929 Bunting Ave #D
- 406 Grays Peak Ct
- 3111 F Rd Unit Studio
- 2915 Orchard Ave Unit B-32
- 2915 Orchard Ave Unit A-11
- 2915 Orchard Ave Unit B15
- 2920 Walnut Ave
- 627 Kings Glen Loop
- 593 Redwing Ln
- 2851 Belford Ave Unit A
- 658 30 Rd
- 2240 Elm Ave Unit B
- 588 W Indian Creek Dr
- 2869 Sophia Way
- 3191 Highview Rd
- 590 Treviso Ct
- 491 28 1 4 Rd
- 631 Highline Dr Unit 631
