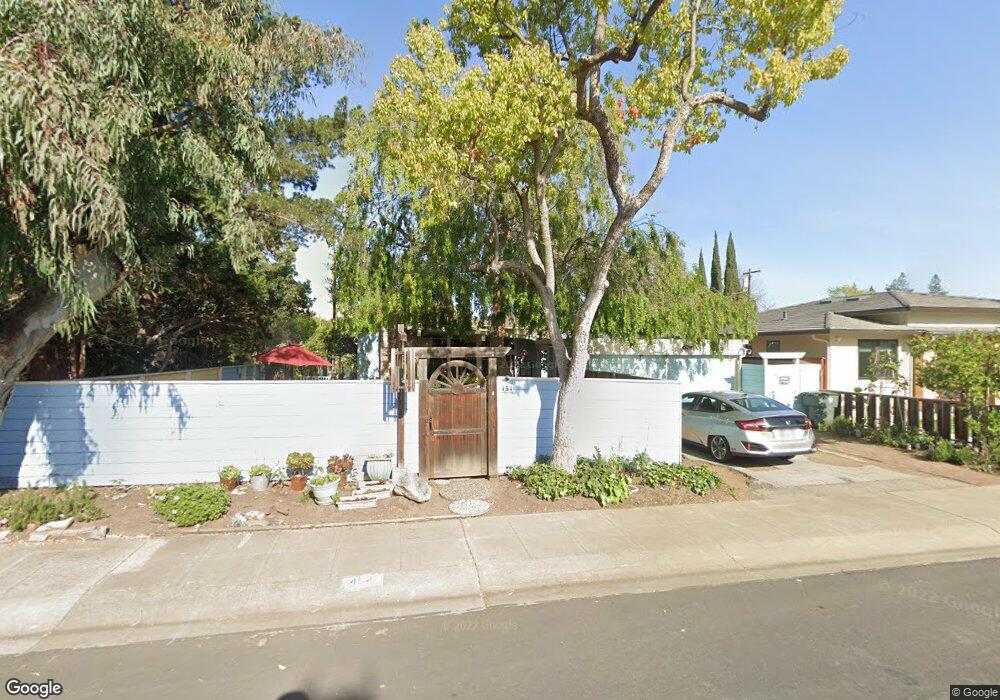
454 Tennessee Ln Palo Alto, CA 94306
Charleston Meadows NeighborhoodEstimated Value: $2,452,000 - $3,207,000
4
Beds
2
Baths
1,080
Sq Ft
$2,708/Sq Ft
Est. Value
About This Home
This home is located at 454 Tennessee Ln, Palo Alto, CA 94306 and is currently estimated at $2,924,431, approximately $2,707 per square foot. 454 Tennessee Ln is a home located in Santa Clara County with nearby schools including Juana Briones Elementary School, Ellen Fletcher Middle, and Henry M. Gunn High School.
Ownership History
Date
Name
Owned For
Owner Type
Purchase Details
Closed on
Dec 30, 2024
Sold by
Ku Vincent and Chen Jenru
Bought by
Ku Family Tree Trust and Ku
Current Estimated Value
Purchase Details
Closed on
Oct 4, 2002
Sold by
Berman Ari and Winston Robin
Bought by
Ku Vincent and Chen Jenru
Home Financials for this Owner
Home Financials are based on the most recent Mortgage that was taken out on this home.
Original Mortgage
$640,000
Interest Rate
5.37%
Purchase Details
Closed on
Jan 24, 1994
Sold by
Seigneur Joel H and Seigneur Alice Fetridge
Bought by
Berman Ari and Winston Robin
Home Financials for this Owner
Home Financials are based on the most recent Mortgage that was taken out on this home.
Original Mortgage
$311,000
Interest Rate
6.62%
Create a Home Valuation Report for This Property
The Home Valuation Report is an in-depth analysis detailing your home's value as well as a comparison with similar homes in the area
Home Values in the Area
Average Home Value in this Area
Purchase History
| Date | Buyer | Sale Price | Title Company |
|---|---|---|---|
| Ku Family Tree Trust | -- | None Listed On Document | |
| Ku Family Tree Trust | -- | None Listed On Document | |
| Ku Vincent | $800,000 | First American Title Company | |
| Berman Ari | -- | American Title Insurance Co |
Source: Public Records
Mortgage History
| Date | Status | Borrower | Loan Amount |
|---|---|---|---|
| Previous Owner | Ku Vincent | $640,000 | |
| Previous Owner | Berman Ari | $311,000 |
Source: Public Records
Tax History Compared to Growth
Tax History
| Year | Tax Paid | Tax Assessment Tax Assessment Total Assessment is a certain percentage of the fair market value that is determined by local assessors to be the total taxable value of land and additions on the property. | Land | Improvement |
|---|---|---|---|---|
| 2025 | $14,276 | $1,158,650 | $579,325 | $579,325 |
| 2024 | $14,276 | $1,135,932 | $567,966 | $567,966 |
| 2023 | $14,276 | $1,113,660 | $556,830 | $556,830 |
| 2022 | $13,893 | $1,091,824 | $545,912 | $545,912 |
| 2021 | $13,617 | $1,070,416 | $535,208 | $535,208 |
| 2020 | $13,345 | $1,059,442 | $529,721 | $529,721 |
| 2019 | $13,193 | $1,038,670 | $519,335 | $519,335 |
| 2018 | $12,842 | $1,018,304 | $509,152 | $509,152 |
| 2017 | $12,614 | $998,338 | $499,169 | $499,169 |
| 2016 | $12,279 | $978,764 | $489,382 | $489,382 |
| 2015 | $12,154 | $964,064 | $482,032 | $482,032 |
| 2014 | $11,852 | $945,180 | $472,590 | $472,590 |
Source: Public Records
Map
Nearby Homes
- 4173 El Camino Real Unit 1
- 342 Carolina Ln
- 4206 Rickeys Way Unit C
- 4132 Thain Way
- 26 Roosevelt Cir
- 4225 Park Blvd
- 717 Los Robles Ave
- 3888 Magnolia Dr
- 3428 Alma Village Cir
- 278 Monroe Dr Unit 35
- 4250 El Camino Real Unit B120
- 3941 Duncan Place
- 579 Glenbrook Dr
- 645 Maybell Ave Unit A
- 4198 Cherry Oaks Place
- 772 Paul Ave
- 4287 Pomona Ave
- 3213 Alma St
- 3324 South Ct
- 923 Shauna Ln
- 444 Tennessee Ln
- 464 Tennessee Ln
- 434 Tennessee Ln
- 473 James Rd
- 487 James Rd
- 463 James Rd
- 453 Tennessee Ln
- 491 James Rd
- 463 Tennessee Ln
- 443 Tennessee Ln
- 473 Tennessee Ln
- 4159 El Camino Way
- 4159 El Camino Way Unit D
- 4159 El Camino Way Unit C
- 4159 El Camino Way Unit B
- 4159 El Camino Way Unit A
- 4159 El Camino Way Unit Q
- 4159 El Camino Way Unit G
- 4159 El Camino Way Unit H
- 4159 El Camino Way Unit I