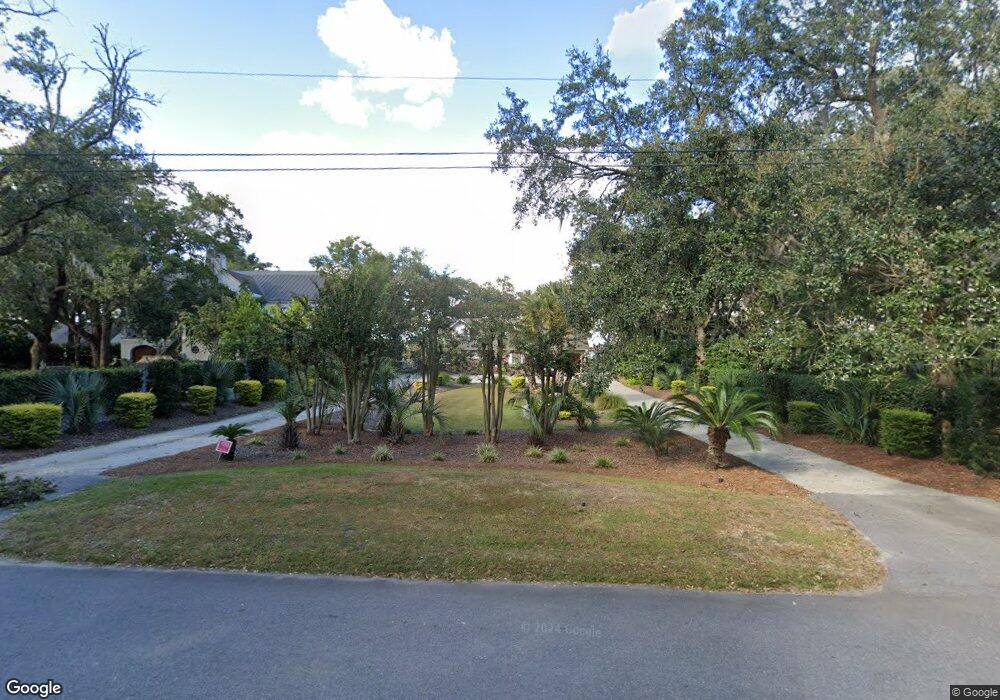
454 Wampler Dr Charleston, SC 29412
James Island NeighborhoodEstimated Value: $1,259,000 - $3,029,000
3
Beds
3
Baths
2,487
Sq Ft
$741/Sq Ft
Est. Value
About This Home
This home is located at 454 Wampler Dr, Charleston, SC 29412 and is currently estimated at $1,843,208, approximately $741 per square foot. 454 Wampler Dr is a home located in Charleston County with nearby schools including Stiles Point Elementary School, Camp Road Middle, and James Island Charter High School.
Ownership History
Date
Name
Owned For
Owner Type
Purchase Details
Closed on
Nov 8, 2010
Sold by
454 Wampler Drive Llc
Bought by
Newell Mitchell D and Newell Sandy M
Current Estimated Value
Purchase Details
Closed on
Oct 20, 2010
Sold by
Pierce Carl E and Pierce Carl
Bought by
454 Wampler Drive Llc
Purchase Details
Closed on
Mar 5, 2009
Sold by
Terry Properties Llc
Bought by
Pierce Ii Carl E
Home Financials for this Owner
Home Financials are based on the most recent Mortgage that was taken out on this home.
Original Mortgage
$712,500
Interest Rate
5.14%
Mortgage Type
Purchase Money Mortgage
Purchase Details
Closed on
Dec 8, 2008
Sold by
Terry Edward L
Bought by
Terry Properties Llc
Purchase Details
Closed on
Jan 23, 2002
Sold by
Terry Edward
Bought by
Terry Edward L
Purchase Details
Closed on
Dec 19, 2001
Sold by
Terry Edward L
Bought by
Terry Edward
Purchase Details
Closed on
Jun 15, 2001
Sold by
Mizzell Oliver Fanny and Mizzell Faye O
Bought by
Terry Edward L
Create a Home Valuation Report for This Property
The Home Valuation Report is an in-depth analysis detailing your home's value as well as a comparison with similar homes in the area
Home Values in the Area
Average Home Value in this Area
Purchase History
| Date | Buyer | Sale Price | Title Company |
|---|---|---|---|
| Newell Mitchell D | $1,000,000 | -- | |
| 454 Wampler Drive Llc | -- | -- | |
| Pierce Ii Carl E | $950,000 | -- | |
| Terry Properties Llc | -- | -- | |
| Terry Edward L | -- | -- | |
| Terry Edward | -- | -- | |
| Terry Edward L | $850,000 | -- |
Source: Public Records
Mortgage History
| Date | Status | Borrower | Loan Amount |
|---|---|---|---|
| Previous Owner | Pierce Ii Carl E | $712,500 |
Source: Public Records
Tax History Compared to Growth
Tax History
| Year | Tax Paid | Tax Assessment Tax Assessment Total Assessment is a certain percentage of the fair market value that is determined by local assessors to be the total taxable value of land and additions on the property. | Land | Improvement |
|---|---|---|---|---|
| 2024 | $5,809 | $45,860 | $0 | $0 |
| 2023 | $5,809 | $45,860 | $0 | $0 |
| 2022 | $5,471 | $45,860 | $0 | $0 |
| 2021 | $5,747 | $45,860 | $0 | $0 |
| 2020 | $5,964 | $45,860 | $0 | $0 |
| 2019 | $5,289 | $39,880 | $0 | $0 |
| 2017 | $5,100 | $39,880 | $0 | $0 |
| 2016 | $4,881 | $39,880 | $0 | $0 |
| 2015 | $5,050 | $39,880 | $0 | $0 |
| 2014 | $4,703 | $0 | $0 | $0 |
| 2011 | -- | $0 | $0 | $0 |
Source: Public Records
Map
Nearby Homes
- 535 Wampler Dr
- 0 Fort Johnson Rd Unit 25005735
- 460 Trapier Dr
- 762 Swanson Ave
- 544 Fort Johnson Rd
- 562 Fort Johnson Rd
- 679 Edmonds Dr
- 683 Edmonds Dr
- 881 Evans Rd
- 874 Evans Rd
- 832 Robert e Lee Blvd
- 897 Kushiwah Creek Ct
- 881 Kushiwah Creek Dr
- 699 Castle Pinckney Dr
- 924 White Point Blvd
- 3009 Allison Cove Dr
- 825 Shutes Folly Dr
- 404 Tanner Trail
- 939 Mikell Dr
- 525 Yellow Tower Terrace
- 450 Wampler Dr
- 458 Wampler Dr
- 506 Wampler Dr
- 446 Wampler Dr
- 508 Wampler Dr
- 668 Wildwood Rd
- 449 Wampler Dr
- 451 Wampler Dr
- 442 Wampler Dr
- 512 Wampler Dr
- 509 Wampler Dr
- 671 Deepwood Dr
- 445 Wampler Dr
- 518 Wampler Dr
- 513 Wampler Dr
- 674 Wildwood Rd
- 672 Deepwood Dr
- 677 Deepwood Dr
- 673 Wildwood Rd
- 517 Wampler Dr