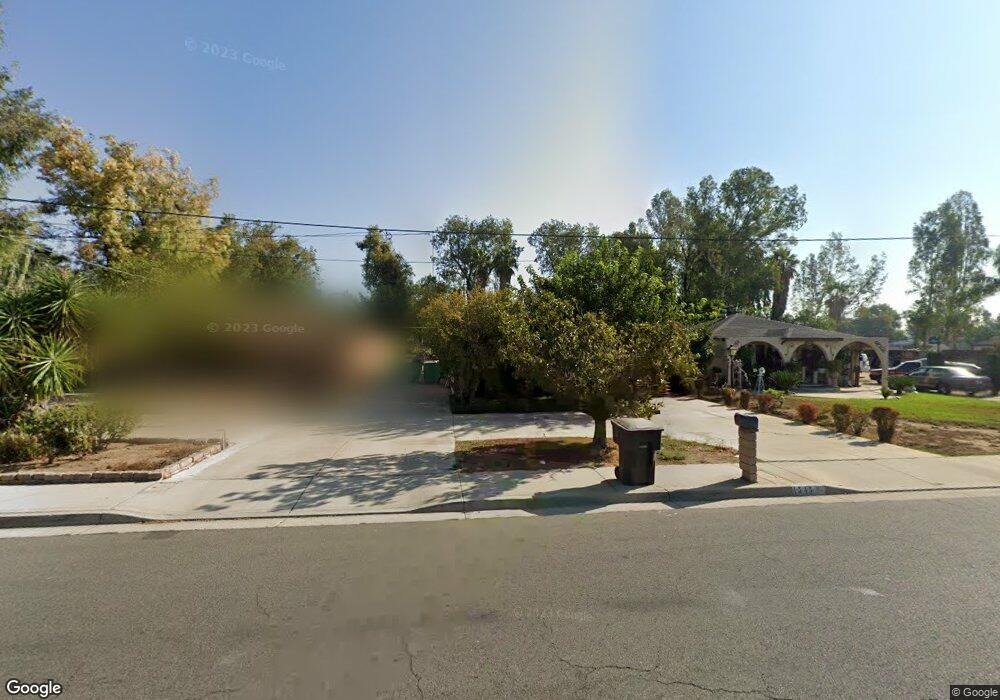
4545 Mobley Ave Riverside, CA 92505
La Sierra NeighborhoodEstimated Value: $448,406 - $538,000
4
Beds
2
Baths
1,280
Sq Ft
$394/Sq Ft
Est. Value
About This Home
This home is located at 4545 Mobley Ave, Riverside, CA 92505 and is currently estimated at $504,602, approximately $394 per square foot. 4545 Mobley Ave is a home located in Riverside County with nearby schools including Myra Linn Elementary School, Arizona Middle School, and La Sierra High School.
Ownership History
Date
Name
Owned For
Owner Type
Purchase Details
Closed on
Oct 18, 2021
Sold by
Malsed Micheal M and Malsed Cynthia Rose
Bought by
Pontremoli Chase and Pontremoli Julia
Current Estimated Value
Home Financials for this Owner
Home Financials are based on the most recent Mortgage that was taken out on this home.
Original Mortgage
$382,936
Outstanding Balance
$350,157
Interest Rate
2.99%
Mortgage Type
FHA
Estimated Equity
$154,445
Purchase Details
Closed on
Aug 8, 2017
Sold by
Johnson Ronald Carl and Johnson Cherie
Bought by
Johnson Ronald Carl and Johnson Cherie L
Purchase Details
Closed on
Oct 15, 2015
Sold by
Johnson Ronald Carl and Johnson Cherie
Bought by
Johnson Ronald Carl and Johnson Cherie
Purchase Details
Closed on
Mar 1, 2007
Sold by
Johnson Ronald Carl and Junk Erye Jean
Bought by
Johnson Ronald Carl and Johnson Cherie
Purchase Details
Closed on
Sep 7, 2004
Sold by
White Carl Junior
Bought by
White Brenda Grayce
Purchase Details
Closed on
Feb 11, 1994
Sold by
Johnson Grayce L
Bought by
Johnson Grayce L
Create a Home Valuation Report for This Property
The Home Valuation Report is an in-depth analysis detailing your home's value as well as a comparison with similar homes in the area
Home Values in the Area
Average Home Value in this Area
Purchase History
| Date | Buyer | Sale Price | Title Company |
|---|---|---|---|
| Pontremoli Chase | $390,000 | First American Title Company | |
| Johnson Ronald Carl | -- | None Available | |
| Johnson Ronald Carl | -- | Stewart | |
| Johnson Ronald Carl | -- | Fidelity Natl Title Ins Co | |
| White Brenda Grayce | -- | Fidelity National Title Ins | |
| Johnson Grayce L | -- | -- |
Source: Public Records
Mortgage History
| Date | Status | Borrower | Loan Amount |
|---|---|---|---|
| Open | Pontremoli Chase | $382,936 |
Source: Public Records
Tax History
| Year | Tax Paid | Tax Assessment Tax Assessment Total Assessment is a certain percentage of the fair market value that is determined by local assessors to be the total taxable value of land and additions on the property. | Land | Improvement |
|---|---|---|---|---|
| 2025 | $4,984 | $413,870 | $127,344 | $286,526 |
| 2023 | $4,984 | $397,800 | $122,400 | $275,400 |
| 2022 | $4,613 | $390,000 | $120,000 | $270,000 |
| 2021 | $5,485 | $281,603 | $66,838 | $214,765 |
| 2020 | $5,387 | $278,716 | $66,153 | $212,563 |
| 2019 | $5,344 | $273,252 | $64,856 | $208,396 |
| 2018 | $5,294 | $267,895 | $63,586 | $204,309 |
| 2017 | $2,273 | $187,050 | $60,953 | $126,097 |
| 2016 | $2,236 | $183,383 | $59,758 | $123,625 |
| 2015 | $335 | $29,338 | $13,541 | $15,797 |
| 2014 | $331 | $28,766 | $13,277 | $15,489 |
Source: Public Records
Map
Nearby Homes
- 10520 Cook Ave
- 4615 Mobley Ave
- 4314 Baggett Dr
- 4834 Hedrick Ave
- 10233 Clara Vista Ln
- 10710 Brookfield Dr
- 0 Cook Ave Unit PW25235031
- 4979 Tyler Meadow Rd
- 5130 Hedrick Ave
- 4998 Bushnell Ave
- 4389 Drexel Ave
- 0 Sunnyslope Ave
- 10881 Sunnyslope Dr Unit 2
- 10450 Gramercy Place
- 10514 Cameo Ct
- 0 Bushnell Ave
- 11140 Bridgepoint Ct
- 11141 Gardenhurst Ct
- 10649 Renner St
- 3946 Tomlinson Ave
- 4551 Mobley Ave
- 4537 Mobley Ave
- 10490 Cook Ave
- 4515 Mobley Ave
- 4540 Mobley Ave
- 4524 Mobley Ave
- 4566 Mobley Ave
- 10526 Wolfe Ave
- 4495 Mobley Ave
- 10523 Bingham Ave Unit 1
- 10523 Bingham Ave
- 10517 Wolfe Ave
- 4582 Mobley Ave
- 4492 Mobley Ave
- 10538 Wolfe Ave
- 10535 Bingham Ave
- 10531 Wolfe Ave
- 10528 Bingham Ave
- 4481 Mobley Ave
- 10532 Cook Ave
Your Personal Tour Guide
Ask me questions while you tour the home.