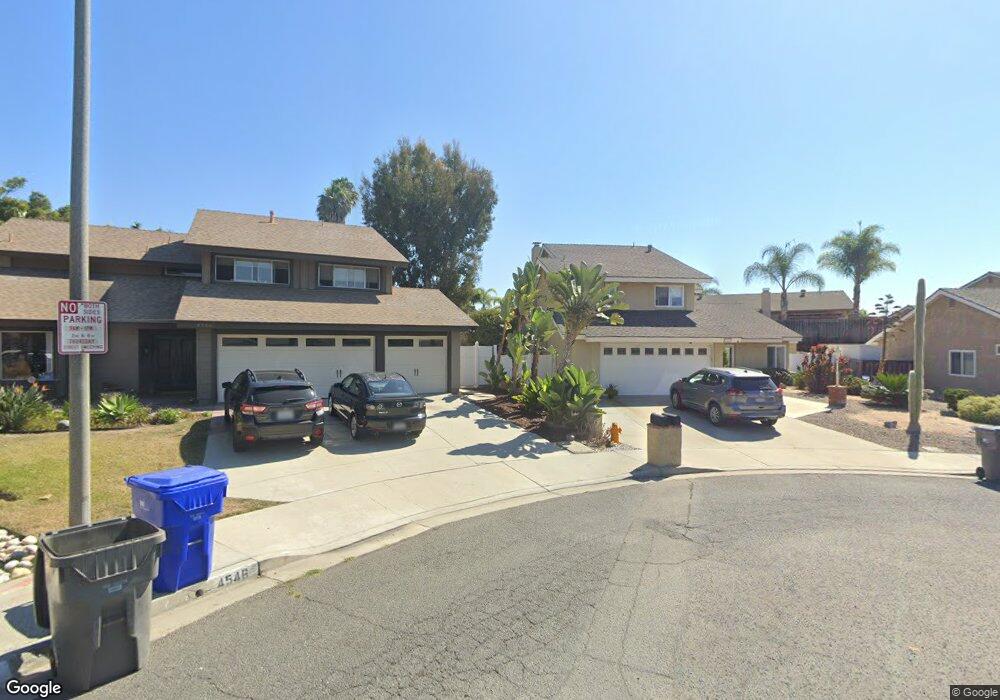
4548 Hancock Cir Oceanside, CA 92056
Ocean Hills NeighborhoodEstimated Value: $955,777 - $1,062,000
4
Beds
3
Baths
1,964
Sq Ft
$522/Sq Ft
Est. Value
About This Home
This home is located at 4548 Hancock Cir, Oceanside, CA 92056 and is currently estimated at $1,025,944, approximately $522 per square foot. 4548 Hancock Cir is a home located in San Diego County with nearby schools including Lake Elementary School, Madison Middle School, and Rancho Buena Vista High School.
Ownership History
Date
Name
Owned For
Owner Type
Purchase Details
Closed on
Mar 23, 2020
Sold by
Schwabe Kristin R
Bought by
Schwabe Kristin R
Current Estimated Value
Purchase Details
Closed on
Feb 5, 2016
Sold by
Class 1 Investment Group Inc
Bought by
Schwabe Kristin R
Home Financials for this Owner
Home Financials are based on the most recent Mortgage that was taken out on this home.
Original Mortgage
$528,255
Outstanding Balance
$419,191
Interest Rate
3.81%
Mortgage Type
FHA
Estimated Equity
$606,753
Purchase Details
Closed on
Jul 3, 2015
Sold by
Ross Michael A and Ross Stephanie J Thomas
Bought by
Class 1 Investment Group Inc
Purchase Details
Closed on
Apr 16, 1993
Bought by
Ross Michael A Thomas-Ross Stephani
Purchase Details
Closed on
Feb 3, 1989
Purchase Details
Closed on
Sep 19, 1988
Create a Home Valuation Report for This Property
The Home Valuation Report is an in-depth analysis detailing your home's value as well as a comparison with similar homes in the area
Home Values in the Area
Average Home Value in this Area
Purchase History
| Date | Buyer | Sale Price | Title Company |
|---|---|---|---|
| Schwabe Kristin R | -- | None Available | |
| Schwabe Kristin R | $538,000 | Fidelity National Title Sd | |
| Class 1 Investment Group Inc | $432,000 | Fidelity National Title | |
| Ross Michael A Thomas-Ross Stephani | $171,000 | -- | |
| -- | $187,600 | -- | |
| -- | $162,500 | -- |
Source: Public Records
Mortgage History
| Date | Status | Borrower | Loan Amount |
|---|---|---|---|
| Open | Schwabe Kristin R | $528,255 |
Source: Public Records
Tax History
| Year | Tax Paid | Tax Assessment Tax Assessment Total Assessment is a certain percentage of the fair market value that is determined by local assessors to be the total taxable value of land and additions on the property. | Land | Improvement |
|---|---|---|---|---|
| 2025 | $6,810 | $636,873 | $405,418 | $231,455 |
| 2024 | $6,810 | $624,386 | $397,469 | $226,917 |
| 2023 | $6,646 | $612,144 | $389,676 | $222,468 |
| 2022 | $6,628 | $600,142 | $382,036 | $218,106 |
| 2021 | $6,480 | $588,376 | $374,546 | $213,830 |
| 2020 | $6,457 | $582,344 | $370,706 | $211,638 |
| 2019 | $6,361 | $570,927 | $363,438 | $207,489 |
| 2018 | $6,048 | $559,733 | $356,312 | $203,421 |
| 2017 | $71 | $548,759 | $349,326 | $199,433 |
| 2016 | $4,733 | $432,000 | $275,000 | $157,000 |
| 2015 | $2,698 | $246,645 | $72,112 | $174,533 |
| 2014 | $2,632 | $241,815 | $70,700 | $171,115 |
Source: Public Records
Map
Nearby Homes
- 4566 Hancock Cir
- 4470 Sapphire Ln
- 3563 Turquoise Ln
- 65 Brookside Ln
- 42 Havenview Ln
- 157 Horizon Ln
- 120 Brookside Ln
- 101 Havenview Ln
- 1937 Sunset Dr
- 1863 Sunset Dr
- 601 Marazon Ln
- 4359 Serena Ave
- 3477 N Sundown Ln
- 4334 Serena Ave
- 200 S Emerald Dr Unit 54
- 3579 Twilight Ln
- 2130 Sunset Dr Unit 55
- 2130 Sunset Dr Unit 134
- 2130 Sunset Dr Unit 70
- 2130 Sunset Dr Unit 69
- 4546 Hancock Cir
- 4550 Hancock Cir
- 4564 Dunhill Ct
- 4566 Dunhill Ct
- 4552 Hancock Cir
- 4563 Dunhill Ct
- 4543 Hancock Cir
- 3563 Evening Canyon Rd
- 4565 Fieldgate Rd
- 4554 Hancock Cir
- 4547 Hancock Cir
- 3565 Evening Canyon Rd
- 4545 Hancock Cir
- 4549 Hancock Cir
- 4568 Dunhill Ct
- 4569 Fieldgate Rd
- 4565 Dunhill Ct
- 4551 Hancock Cir
- 4558 Hancock Cir
- 4561 Fieldgate Rd
Your Personal Tour Guide
Ask me questions while you tour the home.