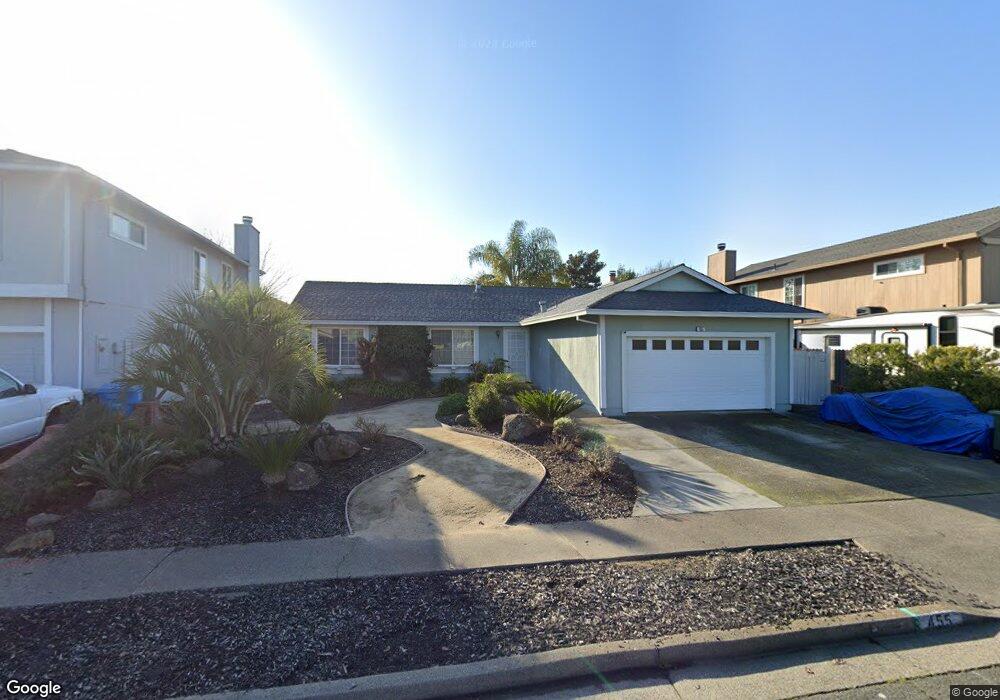
455 Jose Ramon Ave Santa Rosa, CA 95401
Copperfield NeighborhoodEstimated Value: $583,416 - $733,000
3
Beds
2
Baths
1,408
Sq Ft
$474/Sq Ft
Est. Value
About This Home
This home is located at 455 Jose Ramon Ave, Santa Rosa, CA 95401 and is currently estimated at $666,854, approximately $473 per square foot. 455 Jose Ramon Ave is a home located in Sonoma County with nearby schools including Elsie Allen High School, Wright Charter, and Oak Grove Elementary/Willowside Middle School.
Ownership History
Date
Name
Owned For
Owner Type
Purchase Details
Closed on
Oct 28, 2020
Sold by
Mccrummen Connie J
Bought by
Mccrummen Connie Jeanet and Mccrummen Connie Jeanet
Current Estimated Value
Home Financials for this Owner
Home Financials are based on the most recent Mortgage that was taken out on this home.
Original Mortgage
$170,000
Outstanding Balance
$122,792
Interest Rate
2.8%
Mortgage Type
New Conventional
Estimated Equity
$544,062
Purchase Details
Closed on
Apr 30, 2007
Sold by
Mccrummen Connie Jeanet
Bought by
Connie Jeanet Mccrummen Revocable Living
Purchase Details
Closed on
Dec 22, 1999
Sold by
Jeanet Mccrummen Edwin M Dva 455715 and Jeanet Connie
Bought by
Mccrummen Edwin and Mccrummen Connie Jeanet
Home Financials for this Owner
Home Financials are based on the most recent Mortgage that was taken out on this home.
Original Mortgage
$75,000
Interest Rate
7.68%
Mortgage Type
Purchase Money Mortgage
Create a Home Valuation Report for This Property
The Home Valuation Report is an in-depth analysis detailing your home's value as well as a comparison with similar homes in the area
Home Values in the Area
Average Home Value in this Area
Purchase History
| Date | Buyer | Sale Price | Title Company |
|---|---|---|---|
| Mccrummen Connie Jeanet | -- | Fidelity National Title Co | |
| Mccrummen Connie J | -- | Fidelity National Title Co | |
| Connie Jeanet Mccrummen Revocable Living | -- | None Available | |
| Mccrummen Edwin | -- | North Bay Title Co | |
| Mccrummen Edwin M | -- | North Bay Title Co |
Source: Public Records
Mortgage History
| Date | Status | Borrower | Loan Amount |
|---|---|---|---|
| Open | Mccrummen Connie J | $170,000 | |
| Closed | Mccrummen Edwin M | $75,000 |
Source: Public Records
Tax History Compared to Growth
Tax History
| Year | Tax Paid | Tax Assessment Tax Assessment Total Assessment is a certain percentage of the fair market value that is determined by local assessors to be the total taxable value of land and additions on the property. | Land | Improvement |
|---|---|---|---|---|
| 2025 | $1,829 | $165,430 | $52,232 | $113,198 |
| 2024 | $1,829 | $162,187 | $51,208 | $110,979 |
| 2023 | $1,829 | $159,007 | $50,204 | $108,803 |
| 2022 | $1,723 | $155,890 | $49,220 | $106,670 |
| 2021 | $1,691 | $152,834 | $48,255 | $104,579 |
| 2020 | $1,684 | $151,268 | $47,761 | $103,507 |
| 2019 | $1,667 | $148,303 | $46,825 | $101,478 |
| 2018 | $1,653 | $145,396 | $45,907 | $99,489 |
| 2017 | $1,618 | $142,546 | $45,007 | $97,539 |
| 2016 | $1,594 | $139,752 | $44,125 | $95,627 |
| 2015 | $1,542 | $137,654 | $43,463 | $94,191 |
| 2014 | $1,483 | $134,958 | $42,612 | $92,346 |
Source: Public Records
Map
Nearby Homes
- 2400 Valley Dr W
- 438 Rusty Dr
- 2344 Donahue Ave
- 2353 Hood Ct
- 2333 Pacheco Place
- 337 Westmont Place
- 415 Occidental Cir
- 2315 Cross Ave
- 2305 Cross Ave
- 307 Occidental Cir
- 91 Westgate Cir
- 314 Michael Dr
- 948 Brunello Dr
- 213 Monarch Ct
- 224 Regency Ct
- 226 Regency Ct
- 4077 Louis Krohn Dr
- 2154 Longhorn Cir
- 235 Regency Ct
- 4025 Sebastopol Rd
- 457 Jose Ramon Ave
- 453 Jose Ramon Ave
- 430 Nikki Dr
- 432 Nikki Dr
- 459 Jose Ramon Ave
- 428 Nikki Dr
- 2396 Ignacio Ct
- 2399 Valley West Dr
- 2399 Valley Dr W
- 434 Nikki Dr
- 461 Jose Ramon Ave
- 436 Nikki Dr
- 2394 Ignacio Ct
- 2395 Valley West Dr
- 2404 Valley West Dr
- 460 Jose Ramon Ave
- 2400 Valley West Dr
- 2406 Valley West Dr
- 2398 Valley West Dr
- 463 Jose Ramon Ave