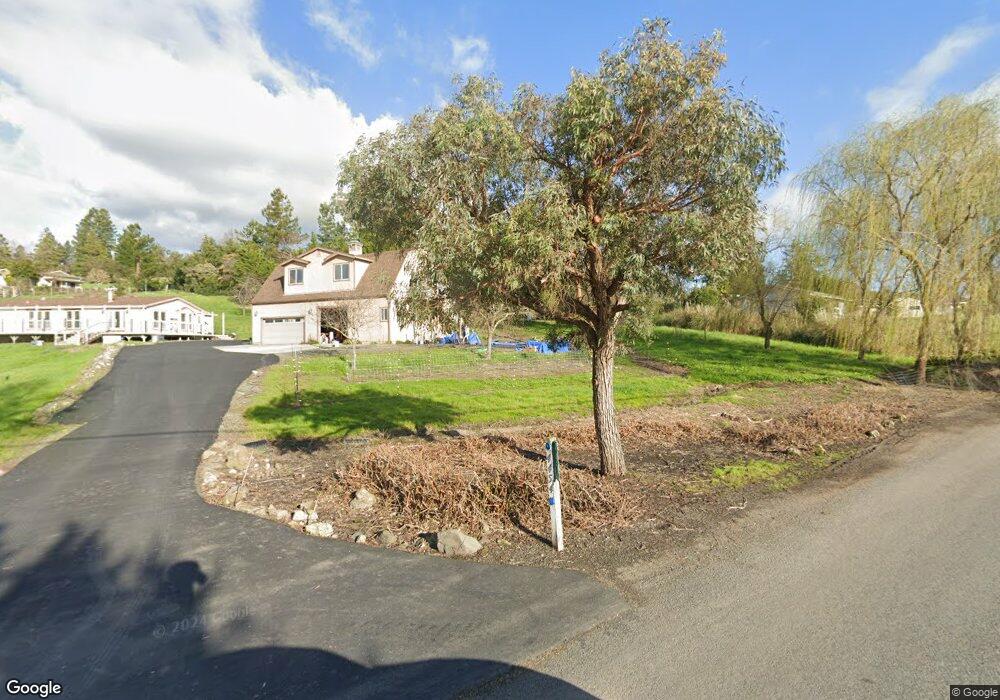
4550 Acacia Way Penngrove, CA 94951
Estimated Value: $1,254,055 - $2,025,000
4
Beds
3
Baths
2,381
Sq Ft
$642/Sq Ft
Est. Value
About This Home
This home is located at 4550 Acacia Way, Penngrove, CA 94951 and is currently estimated at $1,528,764, approximately $642 per square foot. 4550 Acacia Way is a home located in Sonoma County with nearby schools including Petaluma Junior High School and Petaluma High School.
Ownership History
Date
Name
Owned For
Owner Type
Purchase Details
Closed on
Jul 21, 2021
Sold by
Skallerup Nancy W
Bought by
Skallerup Nancy W and The Nancy Skallerup Revocable
Current Estimated Value
Home Financials for this Owner
Home Financials are based on the most recent Mortgage that was taken out on this home.
Original Mortgage
$225,000
Outstanding Balance
$172,149
Interest Rate
2.96%
Mortgage Type
New Conventional
Estimated Equity
$1,356,615
Purchase Details
Closed on
May 25, 2010
Sold by
Skallerup Nancy
Bought by
Skallerup Nancy
Purchase Details
Closed on
Apr 24, 1998
Sold by
Nichols Robert J and Nichols Linda J
Bought by
Skallerup Nancy
Home Financials for this Owner
Home Financials are based on the most recent Mortgage that was taken out on this home.
Original Mortgage
$350,000
Interest Rate
7.06%
Create a Home Valuation Report for This Property
The Home Valuation Report is an in-depth analysis detailing your home's value as well as a comparison with similar homes in the area
Home Values in the Area
Average Home Value in this Area
Purchase History
| Date | Buyer | Sale Price | Title Company |
|---|---|---|---|
| Skallerup Nancy W | -- | Accommodation | |
| Skallerup Nancy W | -- | Accommodation | |
| Skallerup Nancy | -- | None Available | |
| Skallerup Nancy | $500,000 | Old Republic Title Company |
Source: Public Records
Mortgage History
| Date | Status | Borrower | Loan Amount |
|---|---|---|---|
| Open | Skallerup Nancy W | $225,000 | |
| Closed | Skallerup Nancy | $350,000 |
Source: Public Records
Tax History Compared to Growth
Tax History
| Year | Tax Paid | Tax Assessment Tax Assessment Total Assessment is a certain percentage of the fair market value that is determined by local assessors to be the total taxable value of land and additions on the property. | Land | Improvement |
|---|---|---|---|---|
| 2025 | $9,191 | $826,800 | $319,343 | $507,457 |
| 2024 | $9,191 | $810,589 | $313,082 | $497,507 |
| 2023 | $9,191 | $794,696 | $306,944 | $487,752 |
| 2022 | $8,904 | $779,115 | $300,926 | $478,189 |
| 2021 | $8,732 | $763,839 | $295,026 | $468,813 |
| 2020 | $8,794 | $756,007 | $292,001 | $464,006 |
| 2019 | $8,685 | $741,184 | $286,276 | $454,908 |
| 2018 | $8,392 | $726,652 | $280,663 | $445,989 |
| 2017 | $8,215 | $712,405 | $275,160 | $437,245 |
| 2016 | $8,024 | $698,437 | $269,765 | $428,672 |
| 2015 | -- | $687,946 | $265,713 | $422,233 |
| 2014 | -- | $674,472 | $260,509 | $413,963 |
Source: Public Records
Map
Nearby Homes
- 4680 Acacia Ln
- 3340 Lichau Rd
- 6057 Hyland Way
- 6048 Hyland Way
- 6063 Hyland Way
- 6001 Lichau Rd
- 8279 Brand Ln
- 4133 Orr Ranch Rd
- 6750 Petaluma Hill Rd
- 1919 Alan Dr
- 6560 Petaluma Hill Rd
- 4389 Summit View Ranch Rd
- 7517 Windward Dr
- 1809 Alice Dr
- 1649 Wildflower Way
- 1625 Wildflower Way
- 1623 Winterberry Ln
- 9133 Camino Colegio
- Plan 3 at SOMO Village - Synergy
- Plan 4 at SOMO Village - Synergy
- 4454 Acacia Way
- 4560 Acacia Way
- 4553 Acacia Way
- 4670 Acacia Way
- 4680 Acacia Way
- 4680 Acacia Way
- 4600 Acacia Way
- 4444 Acacia Way
- 4622 Acacia Way
- 4595 Acacia Way
- 4628 Acacia Way
- 4401 Pepperwood Dr
- 4425 Acacia Way
- 4401 Acacia Way
- 4607 Acacia Way
- 4615 Acacia Way
- 4410 Acacia Way
- 4623 Acacia Way
- 0 Pepperwood Dr
- 4695 Pepperwood Dr