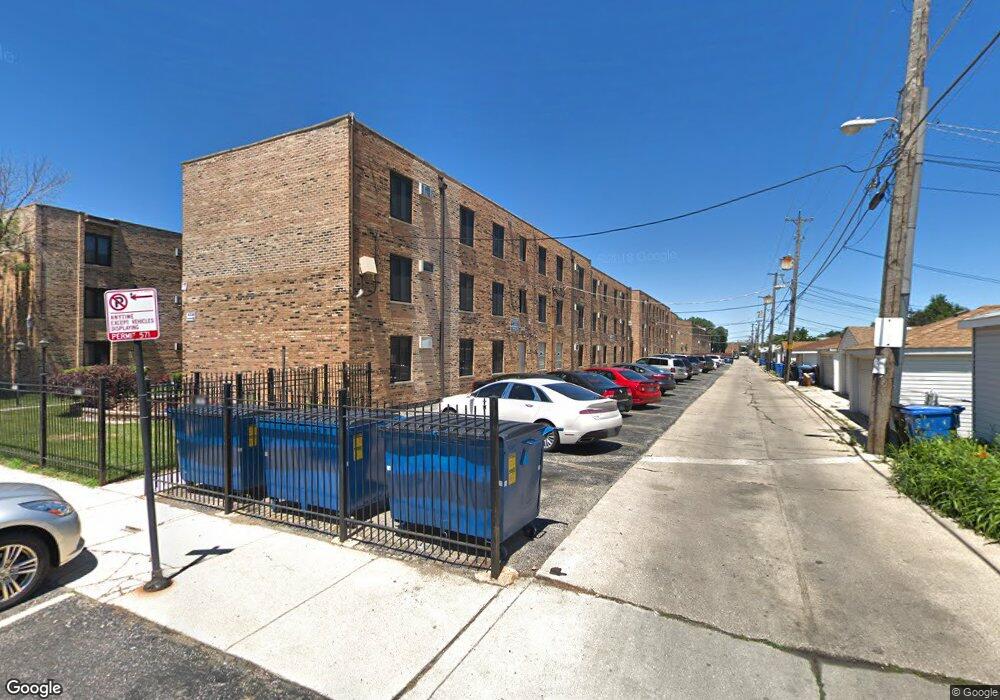
4550 W 57th St Unit 1A1 Chicago, IL 60629
West Elsdon NeighborhoodEstimated Value: $134,467 - $165,000
2
Beds
--
Bath
--
Sq Ft
0.94
Acres
About This Home
This home is located at 4550 W 57th St Unit 1A1, Chicago, IL 60629 and is currently estimated at $155,367. 4550 W 57th St Unit 1A1 is a home located in Cook County with nearby schools including Pasteur Elementary School, Richardson Middle School, and Curie Metropolitan High School.
Ownership History
Date
Name
Owned For
Owner Type
Purchase Details
Closed on
Sep 30, 2004
Sold by
Zavala Victor
Bought by
Delgado Debbie
Current Estimated Value
Home Financials for this Owner
Home Financials are based on the most recent Mortgage that was taken out on this home.
Original Mortgage
$90,400
Outstanding Balance
$48,758
Interest Rate
7.12%
Mortgage Type
Unknown
Estimated Equity
$106,609
Purchase Details
Closed on
Jun 7, 2002
Sold by
Silva Guillermo
Bought by
Zavala Victor
Home Financials for this Owner
Home Financials are based on the most recent Mortgage that was taken out on this home.
Original Mortgage
$88,350
Interest Rate
6.87%
Purchase Details
Closed on
Jul 28, 1999
Sold by
Dermody Ida M
Bought by
Silva Guillermo
Home Financials for this Owner
Home Financials are based on the most recent Mortgage that was taken out on this home.
Original Mortgage
$64,600
Interest Rate
7.77%
Create a Home Valuation Report for This Property
The Home Valuation Report is an in-depth analysis detailing your home's value as well as a comparison with similar homes in the area
Home Values in the Area
Average Home Value in this Area
Purchase History
| Date | Buyer | Sale Price | Title Company |
|---|---|---|---|
| Delgado Debbie | $113,000 | Atgf Inc | |
| Zavala Victor | $93,000 | Chicago Title Insurance Co | |
| Silva Guillermo | $68,000 | -- |
Source: Public Records
Mortgage History
| Date | Status | Borrower | Loan Amount |
|---|---|---|---|
| Open | Delgado Debbie | $90,400 | |
| Previous Owner | Zavala Victor | $88,350 | |
| Previous Owner | Silva Guillermo | $64,600 | |
| Closed | Delgado Debbie | $22,600 |
Source: Public Records
Tax History Compared to Growth
Tax History
| Year | Tax Paid | Tax Assessment Tax Assessment Total Assessment is a certain percentage of the fair market value that is determined by local assessors to be the total taxable value of land and additions on the property. | Land | Improvement |
|---|---|---|---|---|
| 2024 | $1,312 | $14,960 | $771 | $14,189 |
| 2023 | $1,257 | $9,500 | $964 | $8,536 |
| 2022 | $1,257 | $9,500 | $964 | $8,536 |
| 2021 | $1,240 | $9,499 | $964 | $8,535 |
| 2020 | $160 | $3,817 | $964 | $2,853 |
| 2019 | $177 | $4,305 | $964 | $3,341 |
| 2018 | $173 | $4,305 | $964 | $3,341 |
| 2017 | $415 | $5,289 | $867 | $4,422 |
| 2016 | $563 | $5,289 | $867 | $4,422 |
| 2015 | $492 | $5,289 | $867 | $4,422 |
| 2014 | $1,319 | $9,621 | $819 | $8,802 |
| 2013 | $1,282 | $9,621 | $819 | $8,802 |
Source: Public Records
Map
Nearby Homes
- 5614 S Kolmar Ave
- 5551 S Kenneth Ave
- 5749 S Kenneth Ave
- 5444 S Kenneth Ave
- 5910 S Kilbourn Ave
- 6004 S Kolmar Ave
- 5316 S Kenneth Ave Unit 201
- 5316 S Kenneth Ave Unit 101
- 5310 S Kilpatrick Ave
- 6039 S Kilbourn Ave
- 5834 S Keeler Ave
- 4158 W 58th Place Unit 4158
- 5339 S Kildare Ave
- 6053 S Kostner Ave
- 5921 S Keeler Ave
- 5313 S Tripp Ave
- 6146 S Knox Ave
- 4036 W 57th St
- 5438 S Komensky Ave
- 5117 S Keating Ave
- 4550 W 57th St Unit 2CI
- 4550 W 57th St Unit 1-E
- 4550 W 57th St Unit 202
- 4550 W 57th St Unit 2D1
- 4550 W 57th St Unit 2A2
- 4550 W 57th St Unit 1D1
- 4550 W 57th St Unit 1C1
- 4550 W 57th St Unit 3F2
- 4550 W 57th St Unit 3E1
- 4550 W 57th St Unit 2C3
- 4550 W 57th St Unit 3C4
- 4550 W 57th St Unit 2C1
- 4550 W 57th St Unit 1C2
- 4550 W 57th St Unit 2D2
- 4550 W 57th St Unit 1F2
- 4550 W 57th St Unit 1D2
- 4550 W 57th St Unit 1E1
- 4550 W 57th St Unit 3A1
- 4550 W 57th St Unit 3D1
- 4550 W 57th St Unit 3A2