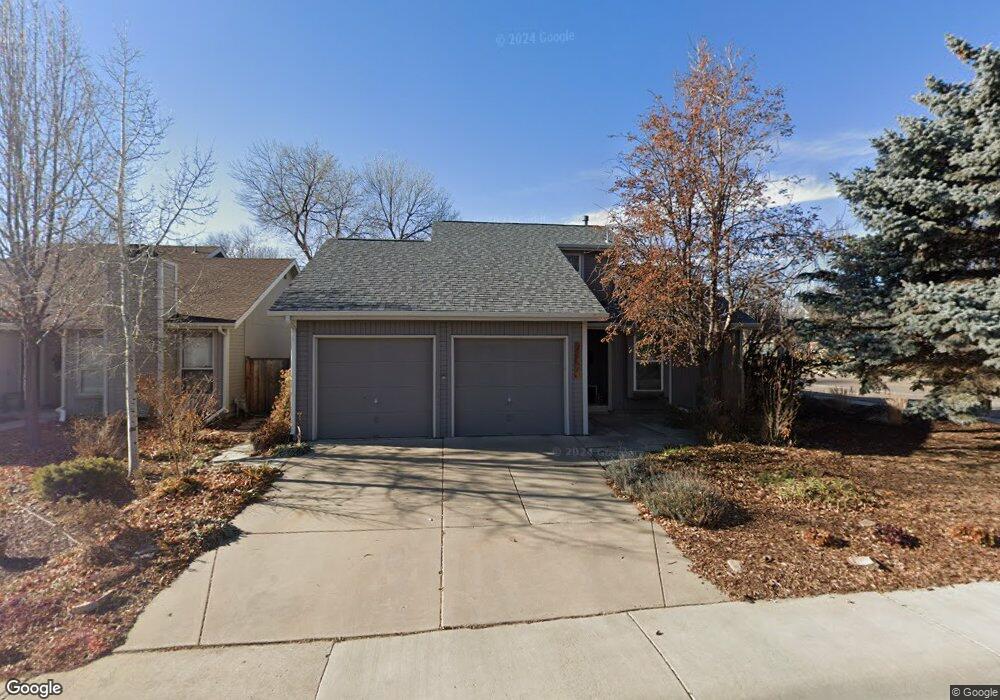
4554 Seaway Cir Fort Collins, CO 80525
The Landings NeighborhoodEstimated Value: $499,000 - $522,000
3
Beds
2
Baths
1,208
Sq Ft
$423/Sq Ft
Est. Value
About This Home
This home is located at 4554 Seaway Cir, Fort Collins, CO 80525 and is currently estimated at $511,497, approximately $423 per square foot. 4554 Seaway Cir is a home located in Larimer County with nearby schools including Kruse Elementary School, Boltz Middle School, and Fort Collins High School.
Ownership History
Date
Name
Owned For
Owner Type
Purchase Details
Closed on
Aug 17, 2010
Sold by
Bradbury Christina Alanna and Ragsdale Derek Glenn
Bought by
Marcrunnel David Arend and Bradfield Brianne Janae
Current Estimated Value
Home Financials for this Owner
Home Financials are based on the most recent Mortgage that was taken out on this home.
Original Mortgage
$175,500
Outstanding Balance
$116,374
Interest Rate
4.6%
Mortgage Type
New Conventional
Estimated Equity
$395,123
Purchase Details
Closed on
Jun 20, 2008
Sold by
Lough Diana G
Bought by
Bradbury Christina Alanna and Ragsdale Derek Glenn
Home Financials for this Owner
Home Financials are based on the most recent Mortgage that was taken out on this home.
Original Mortgage
$191,835
Interest Rate
6.08%
Mortgage Type
Purchase Money Mortgage
Purchase Details
Closed on
Jan 1, 1994
Sold by
Evans Margaret Patricia
Bought by
Lough Diana G
Create a Home Valuation Report for This Property
The Home Valuation Report is an in-depth analysis detailing your home's value as well as a comparison with similar homes in the area
Home Values in the Area
Average Home Value in this Area
Purchase History
| Date | Buyer | Sale Price | Title Company |
|---|---|---|---|
| Marcrunnel David Arend | $195,000 | Land Title Guarantee Company | |
| Bradbury Christina Alanna | $205,000 | Security Title | |
| Lough Diana G | $119,500 | -- |
Source: Public Records
Mortgage History
| Date | Status | Borrower | Loan Amount |
|---|---|---|---|
| Open | Marcrunnel David Arend | $175,500 | |
| Previous Owner | Bradbury Christina Alanna | $191,835 |
Source: Public Records
Tax History Compared to Growth
Tax History
| Year | Tax Paid | Tax Assessment Tax Assessment Total Assessment is a certain percentage of the fair market value that is determined by local assessors to be the total taxable value of land and additions on the property. | Land | Improvement |
|---|---|---|---|---|
| 2025 | $2,924 | $34,163 | $4,020 | $30,143 |
| 2024 | $2,782 | $34,163 | $4,020 | $30,143 |
| 2022 | $2,269 | $24,026 | $4,170 | $19,856 |
| 2021 | $2,293 | $24,718 | $4,290 | $20,428 |
| 2020 | $2,000 | $21,371 | $4,290 | $17,081 |
| 2019 | $2,008 | $21,371 | $4,290 | $17,081 |
| 2018 | $1,794 | $19,685 | $4,320 | $15,365 |
| 2017 | $1,788 | $19,685 | $4,320 | $15,365 |
| 2016 | $1,641 | $17,974 | $4,776 | $13,198 |
| 2015 | $1,629 | $17,980 | $4,780 | $13,200 |
| 2014 | $1,467 | $16,080 | $3,180 | $12,900 |
Source: Public Records
Map
Nearby Homes
- 4506 Seaway Cir
- 4579 Seaboard Ln
- 4560 Seaboard Ln
- 4502 E Boardwalk Dr
- 4545 Wheaton Dr Unit A240
- 4545 Wheaton Dr Unit B210
- 4545 Wheaton Dr Unit A140
- 4271 Southshore Ct
- 4255 Westshore Way Unit F20
- 4212 Cape Cod Cir
- 4218 Cape Cod Cir
- 4414 Monaco Place
- 1213 Silk Oak Ct
- 1149 Valley Oak Ct
- 1600 Shenandoah Cir
- 4751 Pleasant Oak Dr Unit C83
- 4751 Pleasant Oak Dr Unit B39
- 4751 Pleasant Oak Dr Unit C65
- 1140 Red Oak Ct
- 1673 Shenandoah Cir
- 4550 Seaway Cir
- 919 Whalers Way
- 4548 Seaway Cir
- 4502 Seaway Cir
- 4555 Seaway Cir
- 930 Whalers Way
- 4546 Seaway Cir
- 4553 Seaway Cir
- 4504 Seaway Cir
- 924 Whalers Way
- 936 Whalers Way
- 4551 Seaway Cir
- 4549 Seaway Cir
- 4544 Seaway Cir
- 1007 Whalers Way
- 918 Whalers Way
- 949 Sandy Cove Ln
- 4547 Seaway Cir
- 4501 Seaway Cir
- 4503 Seaway Cir