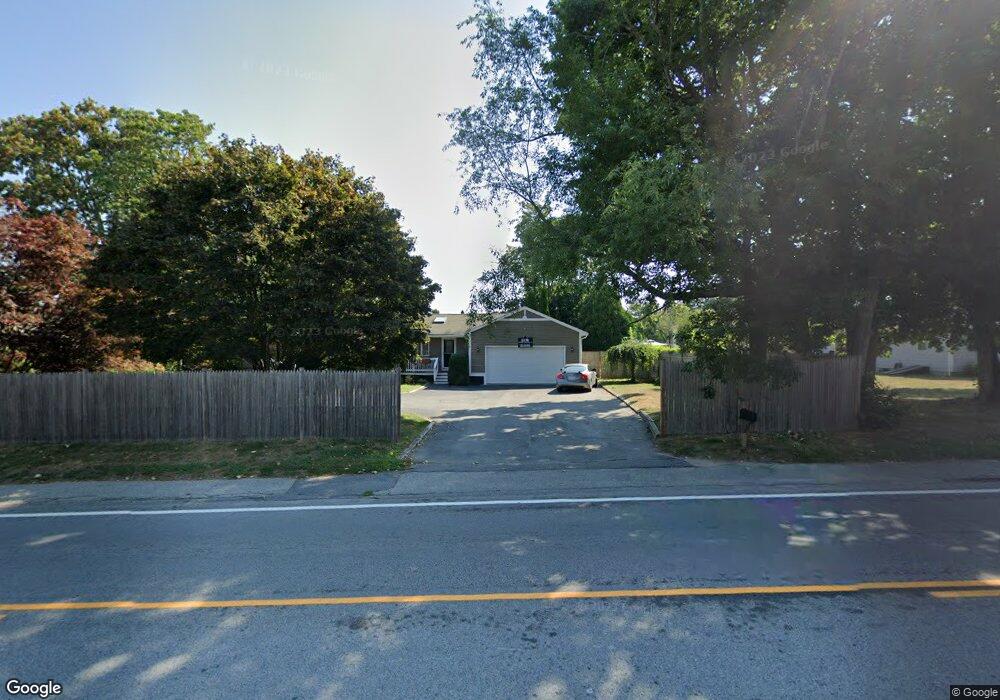
456 Metacom Ave Bristol, RI 02809
Mount Hope NeighborhoodEstimated Value: $625,000 - $692,000
4
Beds
4
Baths
3,312
Sq Ft
$202/Sq Ft
Est. Value
About This Home
This home is located at 456 Metacom Ave, Bristol, RI 02809 and is currently estimated at $670,644, approximately $202 per square foot. 456 Metacom Ave is a home located in Bristol County with nearby schools including Mt. Hope High School, Highlander Charter Middle and High School, and Our Lady of Mt. Carmel School.
Ownership History
Date
Name
Owned For
Owner Type
Purchase Details
Closed on
May 5, 2023
Sold by
Enos Donald
Bought by
Enos Danielle R
Current Estimated Value
Home Financials for this Owner
Home Financials are based on the most recent Mortgage that was taken out on this home.
Original Mortgage
$503,662
Outstanding Balance
$489,348
Interest Rate
6.27%
Mortgage Type
FHA
Estimated Equity
$181,296
Purchase Details
Closed on
Dec 1, 2005
Sold by
Enos Donald R
Bought by
Enos Donald
Home Financials for this Owner
Home Financials are based on the most recent Mortgage that was taken out on this home.
Original Mortgage
$280,000
Interest Rate
6.14%
Mortgage Type
Commercial
Create a Home Valuation Report for This Property
The Home Valuation Report is an in-depth analysis detailing your home's value as well as a comparison with similar homes in the area
Home Values in the Area
Average Home Value in this Area
Purchase History
| Date | Buyer | Sale Price | Title Company |
|---|---|---|---|
| Enos Danielle R | -- | None Available | |
| Enos Danielle R | -- | None Available | |
| Enos Donald | $350,000 | -- | |
| Enos Donald | $350,000 | -- |
Source: Public Records
Mortgage History
| Date | Status | Borrower | Loan Amount |
|---|---|---|---|
| Open | Enos Danielle R | $503,662 | |
| Closed | Enos Danielle R | $503,662 | |
| Previous Owner | Enos Donald | $352,900 | |
| Previous Owner | Enos Donald | $280,000 | |
| Previous Owner | Enos Donald | $70,000 |
Source: Public Records
Tax History Compared to Growth
Tax History
| Year | Tax Paid | Tax Assessment Tax Assessment Total Assessment is a certain percentage of the fair market value that is determined by local assessors to be the total taxable value of land and additions on the property. | Land | Improvement |
|---|---|---|---|---|
| 2025 | $6,183 | $447,400 | $155,100 | $292,300 |
| 2024 | $6,183 | $447,400 | $155,100 | $292,300 |
| 2023 | $5,977 | $447,400 | $155,100 | $292,300 |
| 2022 | $5,816 | $447,400 | $155,100 | $292,300 |
| 2021 | $6,763 | $470,300 | $142,700 | $327,600 |
| 2020 | $6,617 | $470,300 | $142,700 | $327,600 |
| 2019 | $6,453 | $470,300 | $142,700 | $327,600 |
| 2018 | $7,279 | $473,300 | $136,200 | $337,100 |
| 2017 | $5,908 | $396,000 | $118,000 | $278,000 |
| 2016 | $5,849 | $396,000 | $118,000 | $278,000 |
| 2015 | $5,556 | $396,000 | $118,000 | $278,000 |
| 2014 | $5,306 | $406,290 | $133,200 | $273,090 |
Source: Public Records
Map
Nearby Homes
- 6 Scott Ln
- 79 Hopeworth Ave
- 70 Magnolia St
- 214 Franklin St
- 2 Chilton St
- 22 Magnolia St
- 2 Wilson St
- 48 Narrows Rd
- 3 Chestnut St
- 107 Franklin St
- 0 Platt St Unit 1383816
- 413 High St
- 53 Catherine St
- 291 High St
- 7 Knowlton Ct
- 3 Knowlton Ct
- 5 Knowlton Ct
- 82 Charles St
- 44 Bradford St Unit 48
- 44 Bradford St Unit 49