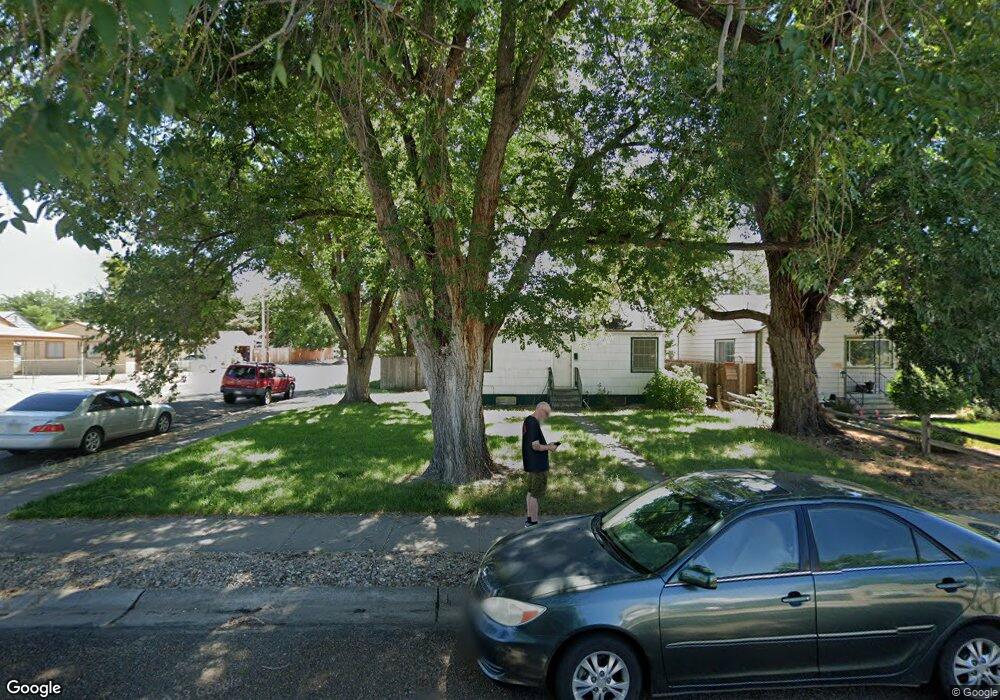
456 N 16th St Grand Junction, CO 81501
Downtown Grand Junction NeighborhoodEstimated Value: $302,000 - $329,000
2
Beds
1
Bath
1,164
Sq Ft
$267/Sq Ft
Est. Value
About This Home
This home is located at 456 N 16th St, Grand Junction, CO 81501 and is currently estimated at $310,444, approximately $266 per square foot. 456 N 16th St is a home located in Mesa County with nearby schools including Chipeta Elementary School, East Middle School, and West Middle School.
Ownership History
Date
Name
Owned For
Owner Type
Purchase Details
Closed on
Jun 28, 1999
Sold by
Stanley Earl Conrad Peggy Gleyn
Bought by
Howell Gregory S and Howell Shawn K
Current Estimated Value
Home Financials for this Owner
Home Financials are based on the most recent Mortgage that was taken out on this home.
Original Mortgage
$83,300
Interest Rate
8.5%
Mortgage Type
Seller Take Back
Purchase Details
Closed on
Jul 6, 1992
Sold by
Wood Douglas J
Bought by
Howell Shawn K
Purchase Details
Closed on
Jul 20, 1990
Sold by
Sikes Mary Ilene
Bought by
Howell Shawn K
Purchase Details
Closed on
Jun 9, 1989
Sold by
Liverance Cheryl C
Bought by
Howell Shawn K
Create a Home Valuation Report for This Property
The Home Valuation Report is an in-depth analysis detailing your home's value as well as a comparison with similar homes in the area
Home Values in the Area
Average Home Value in this Area
Purchase History
| Date | Buyer | Sale Price | Title Company |
|---|---|---|---|
| Howell Gregory S | $84,000 | -- | |
| Howell Shawn K | $42,500 | -- | |
| Howell Shawn K | $37,000 | -- | |
| Howell Shawn K | $34,500 | -- |
Source: Public Records
Mortgage History
| Date | Status | Borrower | Loan Amount |
|---|---|---|---|
| Closed | Howell Gregory S | $83,300 |
Source: Public Records
Tax History Compared to Growth
Tax History
| Year | Tax Paid | Tax Assessment Tax Assessment Total Assessment is a certain percentage of the fair market value that is determined by local assessors to be the total taxable value of land and additions on the property. | Land | Improvement |
|---|---|---|---|---|
| 2024 | $928 | $13,120 | $4,450 | $8,670 |
| 2023 | $928 | $13,120 | $4,450 | $8,670 |
| 2022 | $913 | $12,670 | $3,820 | $8,850 |
| 2021 | $917 | $13,040 | $3,930 | $9,110 |
| 2020 | $728 | $10,590 | $3,580 | $7,010 |
| 2019 | $688 | $10,590 | $3,580 | $7,010 |
| 2018 | $623 | $8,800 | $3,240 | $5,560 |
| 2017 | $575 | $8,800 | $3,240 | $5,560 |
| 2016 | $575 | $9,160 | $3,380 | $5,780 |
| 2015 | $582 | $9,160 | $3,380 | $5,780 |
| 2014 | $531 | $8,420 | $2,790 | $5,630 |
Source: Public Records
Map
Nearby Homes