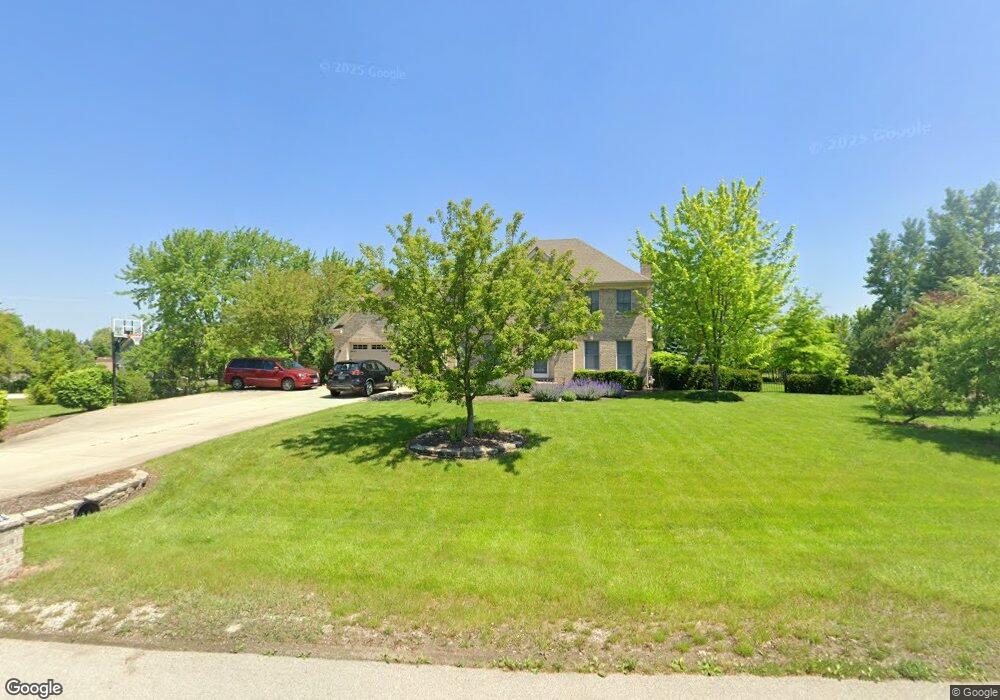
4565 Wayside Ct Unit 1 Oswego, IL 60543
South Oswego NeighborhoodEstimated Value: $565,000 - $630,000
4
Beds
4
Baths
2,678
Sq Ft
$222/Sq Ft
Est. Value
About This Home
This home is located at 4565 Wayside Ct Unit 1, Oswego, IL 60543 and is currently estimated at $594,876, approximately $222 per square foot. 4565 Wayside Ct Unit 1 is a home located in Kendall County with nearby schools including Hunt Club Elementary School, Traughber Junior High School, and Oswego High School.
Ownership History
Date
Name
Owned For
Owner Type
Purchase Details
Closed on
Jul 1, 2024
Sold by
Mateja Daniel N
Bought by
Mateja Daniel N and Chan Kristie W
Current Estimated Value
Purchase Details
Closed on
May 17, 2011
Sold by
Federal Home Loan Mortgage Corporation
Bought by
Mateja Daniel N
Home Financials for this Owner
Home Financials are based on the most recent Mortgage that was taken out on this home.
Original Mortgage
$269,100
Interest Rate
4.81%
Mortgage Type
New Conventional
Purchase Details
Closed on
Jul 29, 2010
Sold by
Preston Brian A
Bought by
Federal Home Loan Mortgage Corp
Purchase Details
Closed on
May 1, 1996
Bought by
Preston Brian A and Preston Catherine C
Create a Home Valuation Report for This Property
The Home Valuation Report is an in-depth analysis detailing your home's value as well as a comparison with similar homes in the area
Home Values in the Area
Average Home Value in this Area
Purchase History
| Date | Buyer | Sale Price | Title Company |
|---|---|---|---|
| Mateja Daniel N | -- | None Listed On Document | |
| Mateja Daniel N | $299,000 | Attorneys Title Guaranty Fun | |
| Federal Home Loan Mortgage Corp | -- | None Available | |
| Preston Brian A | $47,100 | -- |
Source: Public Records
Mortgage History
| Date | Status | Borrower | Loan Amount |
|---|---|---|---|
| Previous Owner | Mateja Daniel N | $269,100 | |
| Closed | Preston Brian A | -- |
Source: Public Records
Tax History Compared to Growth
Tax History
| Year | Tax Paid | Tax Assessment Tax Assessment Total Assessment is a certain percentage of the fair market value that is determined by local assessors to be the total taxable value of land and additions on the property. | Land | Improvement |
|---|---|---|---|---|
| 2024 | $11,037 | $145,430 | $32,311 | $113,119 |
| 2023 | $10,243 | $132,209 | $29,374 | $102,835 |
| 2022 | $10,243 | $121,293 | $26,949 | $94,344 |
| 2021 | $10,290 | $117,760 | $26,164 | $91,596 |
| 2020 | $10,178 | $115,451 | $25,651 | $89,800 |
| 2019 | $10,604 | $118,228 | $25,651 | $92,577 |
| 2018 | $10,127 | $105,911 | $22,979 | $82,932 |
| 2017 | $10,421 | $109,187 | $23,690 | $85,497 |
| 2016 | $10,482 | $108,298 | $28,865 | $79,433 |
| 2015 | $11,000 | $108,298 | $28,865 | $79,433 |
| 2014 | -- | $108,298 | $28,865 | $79,433 |
| 2013 | -- | $105,143 | $28,024 | $77,119 |
Source: Public Records
Map
Nearby Homes
- 609 Chestnut Dr
- 51 Chippewa Dr
- 406 Windsor Dr
- 4713 Cherry Rd
- 53 Abbeyfeale Dr
- 676 Cumberland Ln
- 673 Cumberland Ln
- 668 Cumberland Ln
- 770 Dartmouth Ln
- 851 Claridge Dr
- 315 White Pines Ln
- 4700 Laughton Ave
- 318 Monica Ln
- 2489 Semillon St
- 2486 Semillon St
- 2319 Hirsch Dr
- 612 Murdock Place
- 2492 Semillon St
- 2259 Riesling Rd
- 2255 Riesling Rd
- 5370 Half Round Rd
- 4535 Wayside Ct
- 4530 Wayside Ct
- 5375 Half Round Rd
- 4590 Wayside Ct Unit 1
- 4560 Wayside Ct
- 5360 Half Round Rd
- 5395 Half Round Rd
- 5400 Half Round Rd
- 5355 Half Round Rd
- 4501 Reservation Rd
- 5350 Half Round Rd
- 5045 Half Round Rd
- 5030 Barickman Ct
- 5425 Half Round Rd
- 5020 Barickman Ct Unit 2
- 5335 Half Round Rd
- 5340 Half Round Rd
- 5025 Barickman Ct
- 5440 Half Round Rd