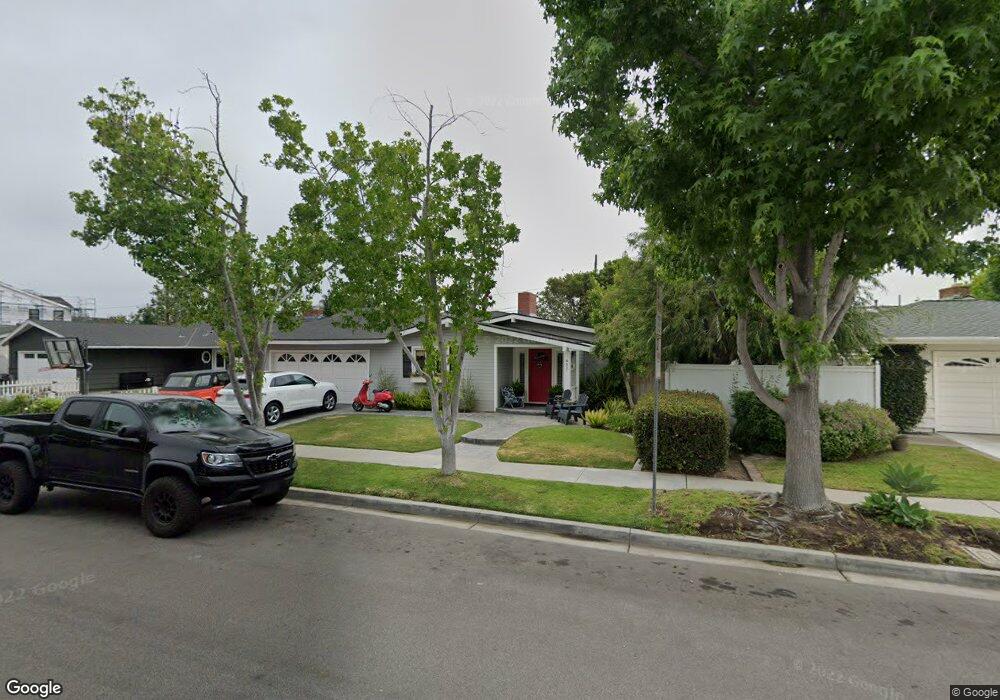
457 Ogle St Costa Mesa, CA 92627
Downtown Costa Mesa NeighborhoodEstimated Value: $1,810,000 - $2,544,000
3
Beds
2
Baths
2,046
Sq Ft
$1,094/Sq Ft
Est. Value
About This Home
This home is located at 457 Ogle St, Costa Mesa, CA 92627 and is currently estimated at $2,238,743, approximately $1,094 per square foot. 457 Ogle St is a home located in Orange County with nearby schools including Newport Heights Elementary, Horace Ensign Intermediate School, and Newport Harbor High School.
Ownership History
Date
Name
Owned For
Owner Type
Purchase Details
Closed on
Sep 11, 1995
Sold by
Carver Mark A and Carver Denise A
Bought by
Kennedy Gregory and Kennedy Janel
Current Estimated Value
Home Financials for this Owner
Home Financials are based on the most recent Mortgage that was taken out on this home.
Original Mortgage
$277,200
Interest Rate
7.87%
Create a Home Valuation Report for This Property
The Home Valuation Report is an in-depth analysis detailing your home's value as well as a comparison with similar homes in the area
Home Values in the Area
Average Home Value in this Area
Purchase History
| Date | Buyer | Sale Price | Title Company |
|---|---|---|---|
| Kennedy Gregory | $346,500 | Stewart Title |
Source: Public Records
Mortgage History
| Date | Status | Borrower | Loan Amount |
|---|---|---|---|
| Closed | Kennedy Gregory | $277,200 |
Source: Public Records
Tax History
| Year | Tax Paid | Tax Assessment Tax Assessment Total Assessment is a certain percentage of the fair market value that is determined by local assessors to be the total taxable value of land and additions on the property. | Land | Improvement |
|---|---|---|---|---|
| 2025 | $7,418 | $628,128 | $461,127 | $167,001 |
| 2024 | $7,418 | $615,812 | $452,085 | $163,727 |
| 2023 | $7,175 | $603,738 | $443,221 | $160,517 |
| 2022 | $6,945 | $591,900 | $434,530 | $157,370 |
| 2021 | $6,746 | $580,295 | $426,010 | $154,285 |
| 2020 | $6,666 | $574,345 | $421,642 | $152,703 |
| 2019 | $6,524 | $563,084 | $413,375 | $149,709 |
| 2018 | $6,392 | $552,044 | $405,270 | $146,774 |
| 2017 | $6,284 | $541,220 | $397,323 | $143,897 |
| 2016 | $6,149 | $530,608 | $389,532 | $141,076 |
| 2015 | $6,090 | $522,638 | $383,681 | $138,957 |
| 2014 | $5,951 | $512,401 | $376,165 | $136,236 |
Source: Public Records
Map
Nearby Homes
- 469 Lenwood Cir
- 766 Tustin Ave Unit 5
- 2217 Laurel Place
- 600 Powell Place
- 2127 Cresta Dr
- 539 Tustin Ave
- 1173 Winslow Ln
- 625 Saint James Rd
- 308 E 18th St
- 1805 Clay St
- 430 Fullerton Ave
- 519 Signal Rd
- 425 Tustin Ave
- 405 El Modena Ave
- 268 E 18th St
- 1586 Orange Ave
- 1232 Blue Gum Ln
- 702 Saint James Place
- 401 Snug Harbor Rd
- 1581 Orange Ave Unit B
Your Personal Tour Guide
Ask me questions while you tour the home.