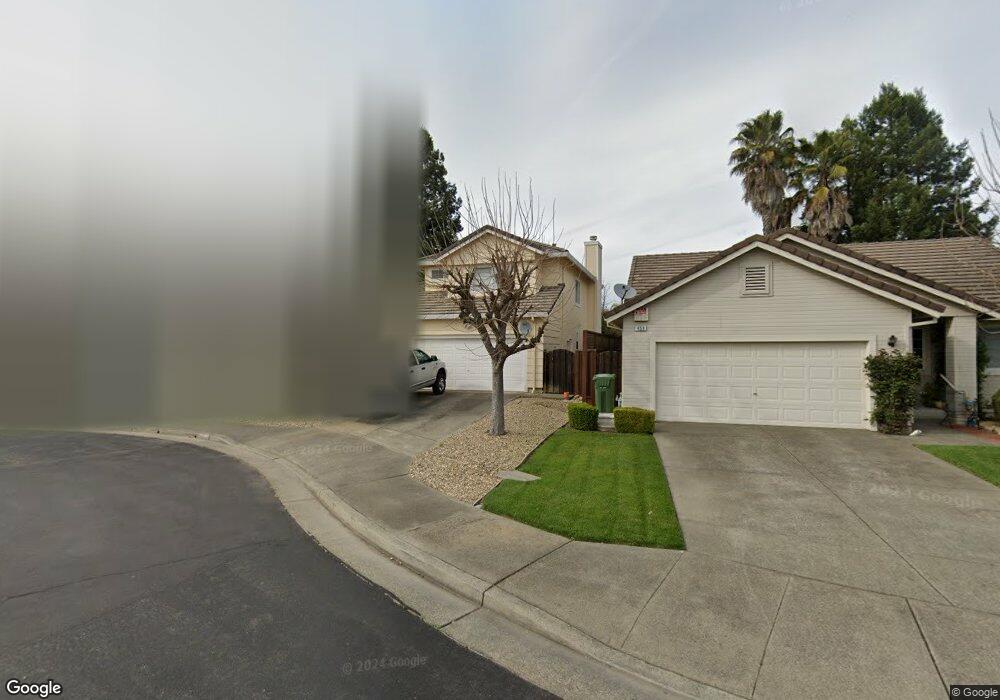
457 Quince St Windsor, CA 95492
Estimated Value: $724,000 - $787,000
3
Beds
3
Baths
1,795
Sq Ft
$417/Sq Ft
Est. Value
About This Home
This home is located at 457 Quince St, Windsor, CA 95492 and is currently estimated at $748,611, approximately $417 per square foot. 457 Quince St is a home located in Sonoma County with nearby schools including Mattie Washburn Elementary School, Brooks Elementary School, and Windsor Middle School.
Ownership History
Date
Name
Owned For
Owner Type
Purchase Details
Closed on
Jul 17, 2025
Sold by
Lau Jan R
Bought by
Jan R Lau Revocable Trust and Lau
Current Estimated Value
Purchase Details
Closed on
Jul 28, 1998
Sold by
Weber Leonard and Weber Kristie
Bought by
Lau Jan R
Home Financials for this Owner
Home Financials are based on the most recent Mortgage that was taken out on this home.
Original Mortgage
$209,000
Interest Rate
6.93%
Purchase Details
Closed on
Dec 9, 1993
Sold by
Calprop Corp
Bought by
Weber Leonard and Weber Kristie
Home Financials for this Owner
Home Financials are based on the most recent Mortgage that was taken out on this home.
Original Mortgage
$195,700
Interest Rate
7.09%
Create a Home Valuation Report for This Property
The Home Valuation Report is an in-depth analysis detailing your home's value as well as a comparison with similar homes in the area
Home Values in the Area
Average Home Value in this Area
Purchase History
We collect this data history from publicly available records. To have your information removed, we recommend requesting removal directly through your county’s website.
| Date | Buyer | Sale Price | Title Company |
|---|---|---|---|
| Jan R Lau Revocable Trust | -- | None Listed On Document | |
| Lau Jan R | $220,000 | North Bay Title Co | |
| Weber Leonard | $206,000 | North American Title Co Inc |
Source: Public Records
Mortgage History
We collect this data history from publicly available records. To have your information removed, we recommend requesting removal directly through your county’s website.
| Date | Status | Borrower | Loan Amount |
|---|---|---|---|
| Previous Owner | Lau Jan R | $209,000 | |
| Previous Owner | Weber Leonard | $195,700 |
Source: Public Records
Tax History
| Year | Tax Paid | Tax Assessment Tax Assessment Total Assessment is a certain percentage of the fair market value that is determined by local assessors to be the total taxable value of land and additions on the property. | Land | Improvement |
|---|---|---|---|---|
| 2025 | $4,312 | $344,885 | $117,569 | $227,316 |
| 2024 | $4,220 | $338,123 | $115,264 | $222,859 |
| 2023 | $4,220 | $331,494 | $113,004 | $218,490 |
| 2022 | $4,069 | $324,995 | $110,789 | $214,206 |
| 2021 | $4,005 | $318,623 | $108,617 | $210,006 |
| 2020 | $4,088 | $315,357 | $107,504 | $207,853 |
| 2019 | $4,081 | $309,175 | $105,397 | $203,778 |
| 2018 | $4,022 | $303,114 | $103,331 | $199,783 |
| 2017 | $3,985 | $297,171 | $101,305 | $195,866 |
| 2016 | $3,741 | $291,345 | $99,319 | $192,026 |
| 2015 | $3,642 | $286,970 | $97,828 | $189,142 |
| 2014 | $3,590 | $281,349 | $95,912 | $185,437 |
Source: Public Records
Map
Nearby Homes
- 8536 Planetree Dr
- 1276 Jensen Ln Unit LOT 2
- 1276 Jensen Ln Unit LOT 1
- 1276 Jensen Ln Unit LOT 3
- 179 Pleasant Ave
- 365 Alden Ct
- 6516 Hwy
- 172 Cornell St
- 9663 Lakewood Dr
- 133 Bluebird Dr
- 333 Cornell Stree
- 159 Amanda Way
- 145 Amanda Way
- 149 Amanda Way
- 592 Peppertree Dr
- 230 Courtyards E
- 7802 Country Meadow Way
- 106 Courtyards E
- 292 Dartmouth Way
- 8690 Old Redwood Hwy
- 459 Quince St
- 451 Quince St
- 724 Hackberry Ct
- 463 Quince St
- 445 Quince St
- 718 Hackberry Ct
- 725 Hackberry Ct
- 379 Sugar Maple Ln
- 467 Quince St
- 439 Quince St
- 458 Quince St
- 385 Sugar Maple Ln
- 517 White Ash Ct
- 712 Hackberry Ct
- 375 Sugar Maple Ln
- 391 Sugar Maple Ln
- 452 Quince St
- 516 White Ash Ct
- 433 Quince St
- 513 White Ash Ct
Your Personal Tour Guide
Ask me questions while you tour the home.