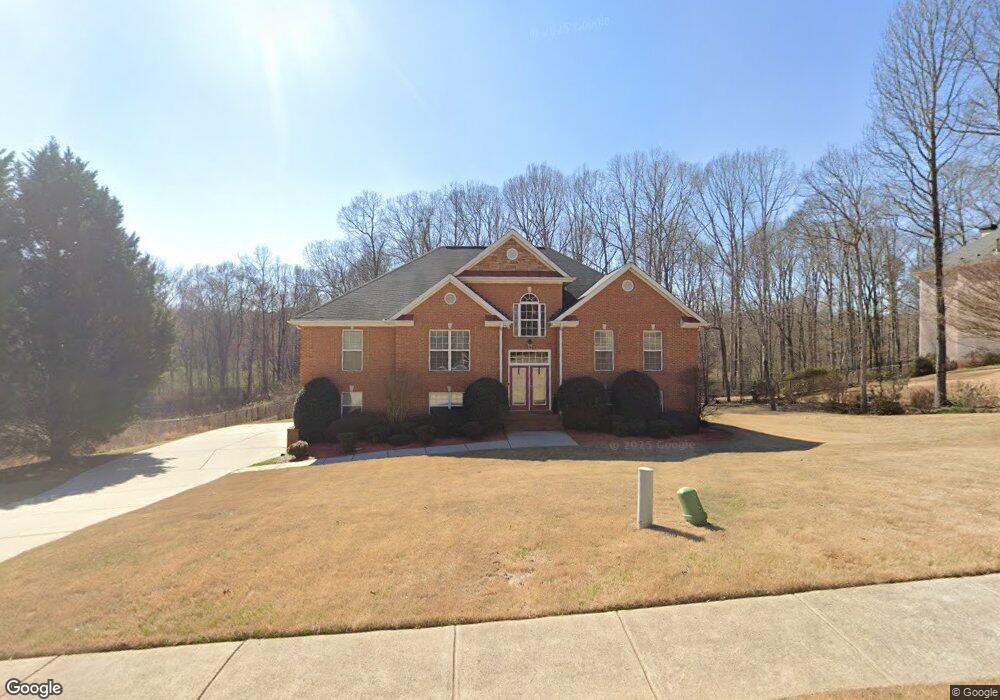
457 Young James Cir Stockbridge, GA 30281
Estimated Value: $487,855 - $579,000
4
Beds
4
Baths
4,168
Sq Ft
$126/Sq Ft
Est. Value
About This Home
This home is located at 457 Young James Cir, Stockbridge, GA 30281 and is currently estimated at $526,714, approximately $126 per square foot. 457 Young James Cir is a home located in Henry County with nearby schools including Cotton Indian Elementary School, Austin Road Middle School, and Stockbridge High School.
Ownership History
Date
Name
Owned For
Owner Type
Purchase Details
Closed on
May 22, 2014
Sold by
Federal National Mortgage Association
Bought by
Wiggins Anthony
Current Estimated Value
Home Financials for this Owner
Home Financials are based on the most recent Mortgage that was taken out on this home.
Original Mortgage
$272,964
Outstanding Balance
$203,424
Interest Rate
3.75%
Mortgage Type
FHA
Estimated Equity
$323,290
Purchase Details
Closed on
Nov 19, 2013
Sold by
Nationstar Mtg Llc
Bought by
Federal National Mtg Associati
Purchase Details
Closed on
Aug 6, 2013
Sold by
Carter-Gay Cori
Bought by
Nationstar Mtg Llc
Purchase Details
Closed on
Apr 27, 2006
Sold by
C & M Home Builders Inc
Bought by
Carter-Gay Cori
Home Financials for this Owner
Home Financials are based on the most recent Mortgage that was taken out on this home.
Original Mortgage
$329,900
Interest Rate
6.39%
Mortgage Type
New Conventional
Create a Home Valuation Report for This Property
The Home Valuation Report is an in-depth analysis detailing your home's value as well as a comparison with similar homes in the area
Home Values in the Area
Average Home Value in this Area
Purchase History
| Date | Buyer | Sale Price | Title Company |
|---|---|---|---|
| Wiggins Anthony | -- | -- | |
| Federal National Mtg Associati | -- | -- | |
| Nationstar Mtg Llc | $175,860 | -- | |
| Carter-Gay Cori | $329,900 | -- |
Source: Public Records
Mortgage History
| Date | Status | Borrower | Loan Amount |
|---|---|---|---|
| Open | Wiggins Anthony | $272,964 | |
| Previous Owner | Carter-Gay Cori | $329,900 |
Source: Public Records
Tax History Compared to Growth
Tax History
| Year | Tax Paid | Tax Assessment Tax Assessment Total Assessment is a certain percentage of the fair market value that is determined by local assessors to be the total taxable value of land and additions on the property. | Land | Improvement |
|---|---|---|---|---|
| 2025 | $5,782 | $206,960 | $24,000 | $182,960 |
| 2024 | $5,782 | $195,120 | $24,000 | $171,120 |
| 2023 | $5,303 | $200,960 | $22,000 | $178,960 |
| 2022 | $4,382 | $140,600 | $16,000 | $124,600 |
| 2021 | $4,026 | $125,560 | $16,000 | $109,560 |
| 2020 | $4,008 | $124,800 | $12,000 | $112,800 |
| 2019 | $3,715 | $112,400 | $12,000 | $100,400 |
| 2018 | $3,454 | $101,320 | $12,000 | $89,320 |
| 2016 | $3,351 | $96,960 | $10,000 | $86,960 |
| 2015 | $3,549 | $101,760 | $10,000 | $91,760 |
| 2014 | $3,478 | $84,920 | $10,000 | $74,920 |
Source: Public Records
Map
Nearby Homes
- 389 Young James Cir
- 393 Young James Cir
- 453 Azalea Dr
- 418 Honeysuckle Ln
- 491 Thurman Rd Unit TRACT C
- 230 Flintlock Trail
- 565 Patillo Rd
- 562 Patillo Rd
- 20 Lamp Post Ct
- 20 Carriage Trace
- 145 Glenloch Pkwy
- 1773 E Atlanta Rd
- 107 Woodridge Dr
- 90 Country Roads Dr
- 219 Thorncrest
- 0 E Atlanta Rd Unit @VALERIE CT 10464740
- 0 E Atlanta Rd Unit @KINSEY DR 10464743
- 108 Hilltop Cir
- 342 Lakeshore Dr
- 105 Bobolink Dr
- 457 Young James Cir Unit 45
- 457 Young James Cir Unit 3
- 0 Young James Cir Unit 8680207
- 0 Young James Cir Unit 8635245
- 0 Young James Cir Unit 7624769
- 0 Young James Cir Unit 8635834
- 0 Young James Cir Unit 7229712
- 0 Young James Cir Unit 8031437
- 0 Young James Cir Unit 8762643
- 0 Young James Cir Unit 8768117
- 0 Young James Cir Unit 8780287
- 0 Young James Cir Unit 3154080
- 0 Young James Cir Unit 3233986
- 461 Young James Cir Unit 128
- 461 Young James Cir Unit 1
- 454 Young James Cir Unit 3
- 500 James Ridge Ln
- 465 Young James Cir
- 465 Young James Cir Unit 1
- 624 Kinley Ln Unit 3