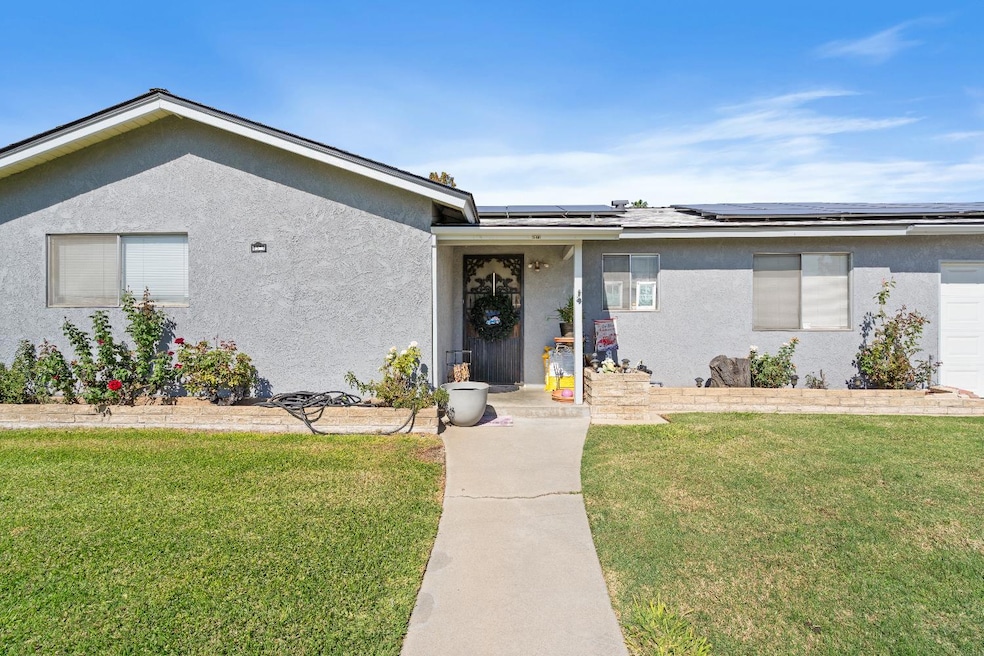
4571 E Fountain Way Fresno, CA 93726
McLane NeighborhoodEstimated payment $1,512/month
Highlights
- Wood Flooring
- Community Spa
- 1-Story Property
- 1 Fireplace
- Covered Patio or Porch
- Central Heating and Cooling System
About This Home
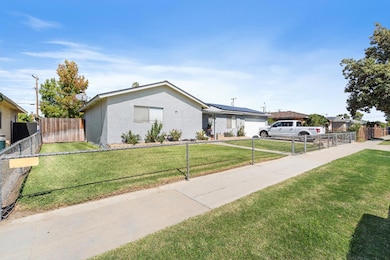
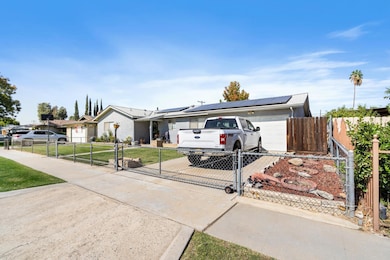
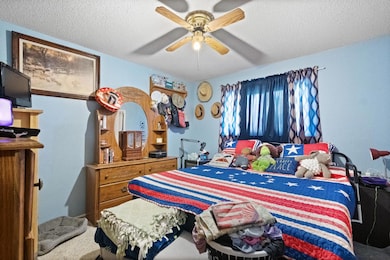
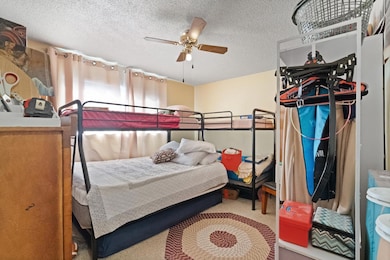
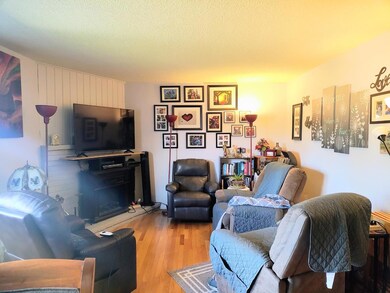
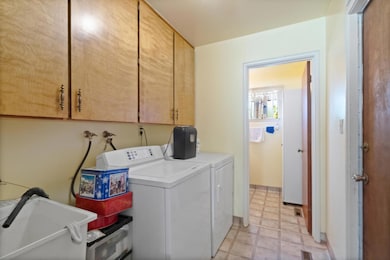
Welcome to this beautifully maintained 2-bedroom, 1.5-bath home offering 1,044 sq. ft. of comfortable living space. Featuring gorgeous hardwood flooring, a new roof, and an upgraded electrical panel, this home is very charming.Enjoy the flexibility of an extra back room that can easily be converted into a third bedroom, home office, or family room. The spacious yard provides plenty of room for outdoor entertaining, gardening, or play.Solar panels will be paid off at the close of escrow, giving you the benefit of energy savings with no additional cost.Don't miss this great opportunity to own a move-in ready home with valuable upgrades and space to grow!
Listing Agent
Marisol Sandoval Perez
Keller Williams Realty Tulare License #02151865 Listed on: 10/16/2025

Home Details
Home Type
- Single Family
Est. Annual Taxes
- $2,349
Year Built
- Built in 1959
Lot Details
- 7,548 Sq Ft Lot
- Lot Dimensions are 74x102
- Front Yard Sprinklers
- Property is zoned RS5
Home Design
- Wood Foundation
- Composition Roof
- Stucco
Interior Spaces
- 1,044 Sq Ft Home
- 1-Story Property
- 1 Fireplace
- Laundry in unit
Flooring
- Wood
- Carpet
Bedrooms and Bathrooms
- 2 Bedrooms
- 1.5 Bathrooms
Additional Features
- Covered Patio or Porch
- Central Heating and Cooling System
Community Details
- Community Spa
Map
Home Values in the Area
Average Home Value in this Area
Tax History
| Year | Tax Paid | Tax Assessment Tax Assessment Total Assessment is a certain percentage of the fair market value that is determined by local assessors to be the total taxable value of land and additions on the property. | Land | Improvement |
|---|---|---|---|---|
| 2025 | $2,349 | $180,296 | $43,440 | $136,856 |
| 2023 | $2,217 | $173,297 | $41,754 | $131,543 |
| 2022 | $2,186 | $169,900 | $40,936 | $128,964 |
| 2021 | $2,127 | $166,570 | $40,134 | $126,436 |
| 2020 | $2,117 | $164,863 | $39,723 | $125,140 |
| 2019 | $2,022 | $160,500 | $38,400 | $122,100 |
| 2018 | $1,980 | $157,500 | $37,700 | $119,800 |
| 2017 | $1,858 | $147,300 | $35,300 | $112,000 |
| 2016 | $1,747 | $140,400 | $33,700 | $106,700 |
| 2015 | $1,577 | $126,600 | $30,400 | $96,200 |
| 2014 | $1,480 | $118,600 | $28,500 | $90,100 |
Property History
| Date | Event | Price | List to Sale | Price per Sq Ft |
|---|---|---|---|---|
| 10/22/2025 10/22/25 | Pending | -- | -- | -- |
| 10/16/2025 10/16/25 | Price Changed | $249,990 | -99.9% | $239 / Sq Ft |
| 10/16/2025 10/16/25 | For Sale | $249,900,000 | -- | $239,368 / Sq Ft |
Purchase History
| Date | Type | Sale Price | Title Company |
|---|---|---|---|
| Grant Deed | $124,500 | First American Title Ins Co | |
| Grant Deed | $82,000 | Chicago Title Co | |
| Grant Deed | -- | -- | |
| Interfamily Deed Transfer | -- | -- |
Mortgage History
| Date | Status | Loan Amount | Loan Type |
|---|---|---|---|
| Open | $124,500 | No Value Available | |
| Previous Owner | $73,800 | No Value Available |
Source: Fresno MLS
MLS Number: 638571
APN: 438-164-16
Disclaimer: Certain information contained herein is derived from information provided by parties other than Homes.com. All information provided is deemed reliable, but is not guaranteed to be accurate and should be independently verified.
![]() IDX information is provided exclusively for personal, non-commercial use, and may not be used for any purpose other than to identify prospective properties consumers may be interested in purchasing. Information is deemed reliable but not guaranteed.
IDX information is provided exclusively for personal, non-commercial use, and may not be used for any purpose other than to identify prospective properties consumers may be interested in purchasing. Information is deemed reliable but not guaranteed.
- 4454 E Simpson Ave
- 4704 E Simpson Ave
- 4785 E Andrews Ave
- 4787 E Cornell Ave
- 3945 E Cortland Ave
- 3913 E Fountain Way
- 4002 E Dakota Ave Unit 104
- 4041 E Saginaw Way
- 4052 E Farrin Ave
- 3803 E Shields Ave
- 2114 N Maple Ave
- 3404 N Millbrook Ave Unit SP 53
- 4404 E Buckingham Way
- 2243 E Cambridge Ave
- 4597 E Cambridge Ave
- 4886 E Brown Ave
- 4565 E Normal Ave
- 3645 E Cortland Ave
- 2130 N Garden Ave
- 4295 N Archie Ave