4572 Mowry Ave Fremont, CA 94538
Sundale NeighborhoodEstimated Value: $1,331,000 - $1,595,000
4
Beds
3
Baths
1,488
Sq Ft
$981/Sq Ft
Est. Value
About This Home
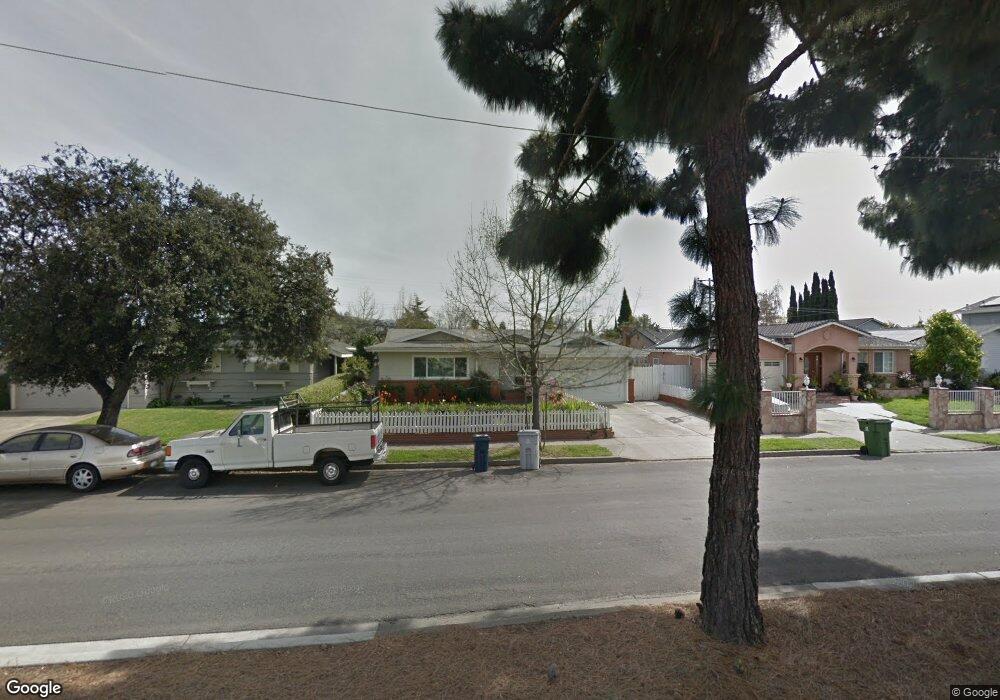
This home is located at 4572 Mowry Ave, Fremont, CA 94538 and is currently estimated at $1,460,004, approximately $981 per square foot. 4572 Mowry Ave is a home located in Alameda County with nearby schools including Brier Elementary School, G.M. Walters Middle School, and John F. Kennedy High School.
Ownership History
Date
Name
Owned For
Owner Type
Purchase Details
Closed on
Feb 1, 2017
Sold by
Gubbala Sunitha
Bought by
Gubbala Sunitha and Gubbala Ravikumar
Current Estimated Value
Home Financials for this Owner
Home Financials are based on the most recent Mortgage that was taken out on this home.
Original Mortgage
$451,500
Outstanding Balance
$371,712
Interest Rate
4%
Mortgage Type
Adjustable Rate Mortgage/ARM
Estimated Equity
$1,088,292
Purchase Details
Closed on
Sep 28, 2009
Sold by
Gubbala Ravikummar
Bought by
Gubbala Sunitha
Home Financials for this Owner
Home Financials are based on the most recent Mortgage that was taken out on this home.
Original Mortgage
$486,034
Interest Rate
5.08%
Mortgage Type
FHA
Purchase Details
Closed on
Aug 4, 2005
Sold by
Shu John Chiyung
Bought by
Livi Shu John Chiyung and Livi John C Shu 2005 Revocable
Create a Home Valuation Report for This Property
The Home Valuation Report is an in-depth analysis detailing your home's value as well as a comparison with similar homes in the area
Home Values in the Area
Average Home Value in this Area
Purchase History
| Date | Buyer | Sale Price | Title Company |
|---|---|---|---|
| Gubbala Sunitha | -- | Wfg National Title Ins Co | |
| Gubbala Sunitha | -- | Chicago Title Company | |
| Gubbala Sunitha | $495,000 | Chicago Title Company | |
| Livi Shu John Chiyung | -- | -- |
Source: Public Records
Mortgage History
| Date | Status | Borrower | Loan Amount |
|---|---|---|---|
| Open | Gubbala Sunitha | $451,500 | |
| Closed | Gubbala Sunitha | $486,034 |
Source: Public Records
Tax History Compared to Growth
Tax History
| Year | Tax Paid | Tax Assessment Tax Assessment Total Assessment is a certain percentage of the fair market value that is determined by local assessors to be the total taxable value of land and additions on the property. | Land | Improvement |
|---|---|---|---|---|
| 2025 | $7,838 | $631,910 | $191,673 | $447,237 |
| 2024 | $7,838 | $619,387 | $187,916 | $438,471 |
| 2023 | $7,621 | $614,106 | $184,232 | $429,874 |
| 2022 | $7,514 | $595,067 | $180,620 | $421,447 |
| 2021 | $7,331 | $583,267 | $177,080 | $413,187 |
| 2020 | $7,325 | $584,218 | $175,265 | $408,953 |
| 2019 | $7,242 | $572,764 | $171,829 | $400,935 |
| 2018 | $7,099 | $561,537 | $168,461 | $393,076 |
| 2017 | $6,921 | $550,528 | $165,158 | $385,370 |
| 2016 | $6,798 | $539,737 | $161,921 | $377,816 |
| 2015 | $6,703 | $531,634 | $159,490 | $372,144 |
| 2014 | $6,585 | $521,224 | $156,367 | $364,857 |
Source: Public Records
Map
Nearby Homes
- 4714 Serra Ave
- 39090 Presidio Way Unit 237
- 39530 Dorrington Ct
- 4754 Northdale Dr
- 4237 Garland Dr
- 4328 Cognina Ct
- 38837 Fremont Blvd
- 4715 Eggers Dr
- 5033 Blacksand Rd
- 4600 Nelson St
- 39134 Memorial St
- 38265 Corrigan Ct
- 38324 Blacow Rd
- 39193 State St
- 4586 Norris Rd
- 4737 Boone Dr
- 39751 Bissy Common
- 5330 Coco Palm Dr
- 38611 Country Common
- 39850 Sundale Dr