4573 Burkey Rd Youngstown, OH 44515
Austintown NeighborhoodEstimated Value: $105,000 - $163,000
3
Beds
1
Bath
1,344
Sq Ft
$99/Sq Ft
Est. Value
About This Home
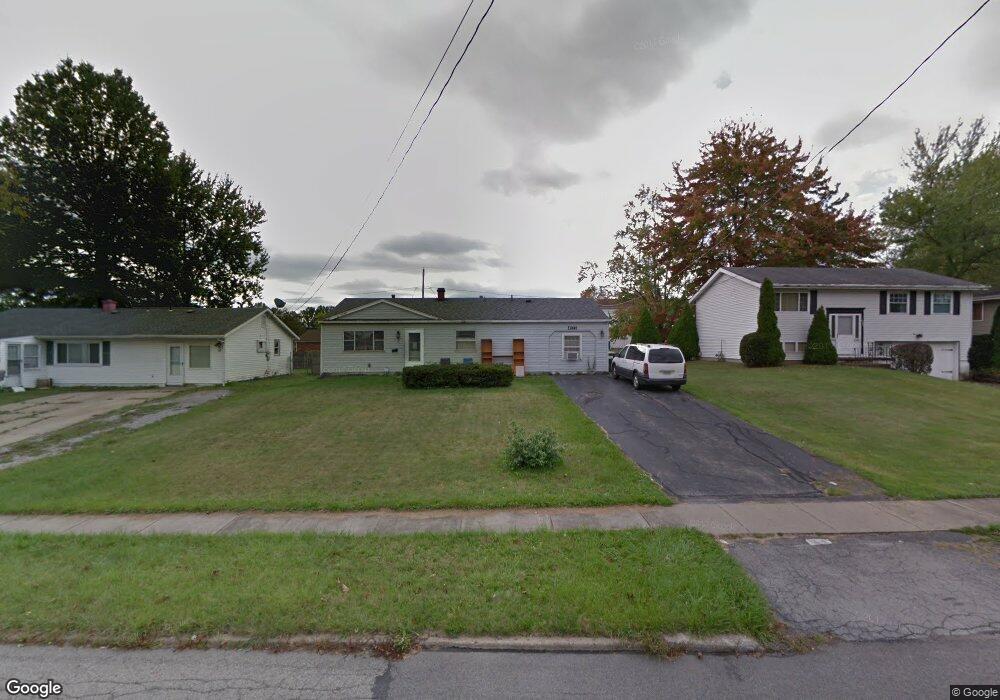
This home is located at 4573 Burkey Rd, Youngstown, OH 44515 and is currently estimated at $133,196, approximately $99 per square foot. 4573 Burkey Rd is a home located in Mahoning County with nearby schools including Austintown Elementary School, Austintown Intermediate School, and Austintown Middle School.
Ownership History
Date
Name
Owned For
Owner Type
Purchase Details
Closed on
Jun 16, 2008
Sold by
Secretary Of Housing & Urban Development
Bought by
Jenkins Franklin D
Current Estimated Value
Home Financials for this Owner
Home Financials are based on the most recent Mortgage that was taken out on this home.
Original Mortgage
$36,793
Outstanding Balance
$23,196
Interest Rate
6.05%
Mortgage Type
FHA
Estimated Equity
$110,000
Purchase Details
Closed on
Jun 1, 2007
Sold by
Dobson Jeffrey A
Bought by
Hud
Purchase Details
Closed on
Aug 1, 2003
Sold by
Jane Hopfer Betty
Bought by
Dobson Jeffrey A and Dobson Julie M
Home Financials for this Owner
Home Financials are based on the most recent Mortgage that was taken out on this home.
Original Mortgage
$62,420
Interest Rate
5.31%
Mortgage Type
FHA
Purchase Details
Closed on
Jan 1, 1990
Bought by
Hopper William H
Create a Home Valuation Report for This Property
The Home Valuation Report is an in-depth analysis detailing your home's value as well as a comparison with similar homes in the area
Home Values in the Area
Average Home Value in this Area
Purchase History
| Date | Buyer | Sale Price | Title Company |
|---|---|---|---|
| Jenkins Franklin D | $36,364 | Lakeside Title & Escrow Agen | |
| Hud | $55,000 | None Available | |
| Dobson Jeffrey A | $63,400 | -- | |
| Hopper William H | -- | -- |
Source: Public Records
Mortgage History
| Date | Status | Borrower | Loan Amount |
|---|---|---|---|
| Open | Jenkins Franklin D | $36,793 | |
| Previous Owner | Dobson Jeffrey A | $62,420 |
Source: Public Records
Tax History
| Year | Tax Paid | Tax Assessment Tax Assessment Total Assessment is a certain percentage of the fair market value that is determined by local assessors to be the total taxable value of land and additions on the property. | Land | Improvement |
|---|---|---|---|---|
| 2025 | $1,419 | $28,900 | $5,090 | $23,810 |
| 2024 | $1,356 | $28,900 | $5,090 | $23,810 |
| 2023 | $1,335 | $28,900 | $5,090 | $23,810 |
| 2022 | $1,213 | $21,030 | $4,070 | $16,960 |
| 2021 | $1,213 | $21,030 | $4,070 | $16,960 |
| 2020 | $1,218 | $21,030 | $4,070 | $16,960 |
| 2019 | $1,117 | $17,530 | $3,400 | $14,130 |
| 2018 | $1,076 | $17,530 | $3,400 | $14,130 |
| 2017 | $1,180 | $17,530 | $3,400 | $14,130 |
| 2016 | $1,286 | $20,810 | $4,770 | $16,040 |
| 2015 | $1,248 | $20,810 | $4,770 | $16,040 |
| 2014 | $1,754 | $20,810 | $4,770 | $16,040 |
| 2013 | $1,742 | $20,810 | $4,770 | $16,040 |
Source: Public Records
Map
Nearby Homes
- 4828 Shadow Oak Dr
- 603 S Raccoon Rd Unit 9
- 603 S Raccoon Rd Unit 14
- 603 S Raccoon Rd Unit 61
- 4876 Shadow Oak Dr
- 4888 Shadow Oak Dr
- 406 S Raccoon Rd
- 4829 New Rd
- 4202 Burkey Rd
- 225 S Raccoon Rd
- 425 Southward Dr
- 4656 Pinegrove Ave
- 255 S Beverly Ave
- 1707 Westhampton Dr
- 431 Westgate Blvd
- 325 S Inglewood Ave
- 4103 Woodmere Dr
- 4102 Burkey Rd
- 4314 Kerrybrook Dr
- 2257 Breezewood Dr
Your Personal Tour Guide
Ask me questions while you tour the home.