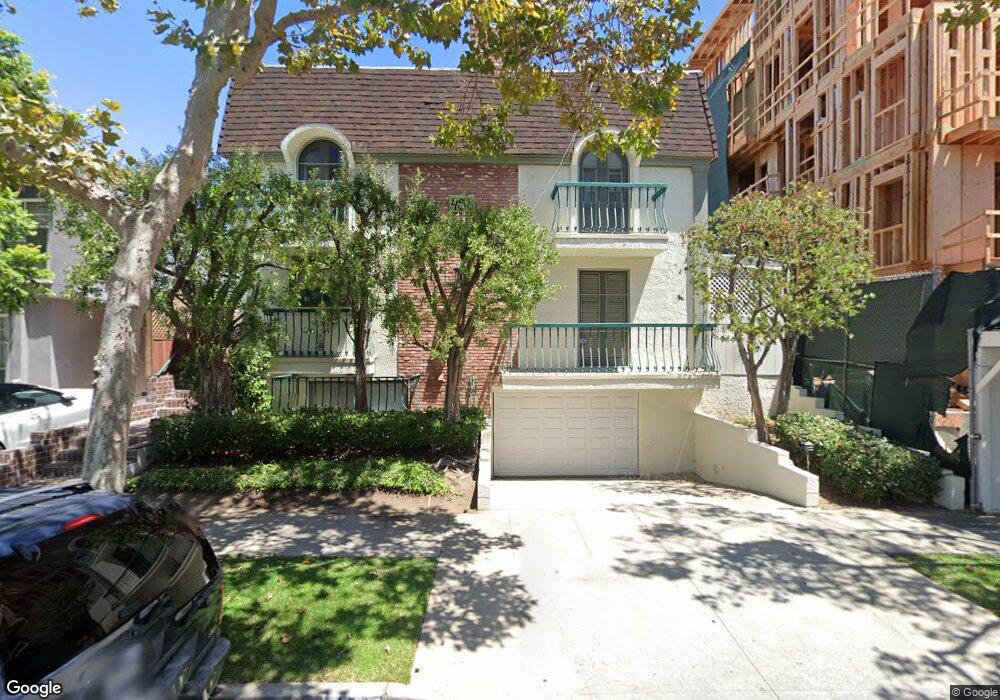
458 S Rexford Dr Unit D Beverly Hills, CA 90212
Estimated Value: $1,190,000 - $1,494,000
2
Beds
3
Baths
1,888
Sq Ft
$683/Sq Ft
Est. Value
About This Home
This home is located at 458 S Rexford Dr Unit D, Beverly Hills, CA 90212 and is currently estimated at $1,289,994, approximately $683 per square foot. 458 S Rexford Dr Unit D is a home located in Los Angeles County with nearby schools including Beverly Vista Elementary School, Beverly Hills High School, and Harkham Hillel Hebrew Academy.
Ownership History
Date
Name
Owned For
Owner Type
Purchase Details
Closed on
Dec 13, 2014
Sold by
Rosen Dark Clark
Bought by
Smith Harris S and Dale C Rosen 2002 Trust
Current Estimated Value
Purchase Details
Closed on
Dec 18, 2012
Sold by
Rosen Allen H
Bought by
Rosen Dale Clark and Feigenbaum Charna
Purchase Details
Closed on
Feb 12, 2004
Sold by
Rosen Allen H and Rosen Dale Clark
Bought by
Rosen Allen H
Purchase Details
Closed on
Feb 10, 2004
Sold by
Rosen Simy M
Bought by
Rosen Allen H
Purchase Details
Closed on
Jan 7, 2002
Sold by
Rosen Allen H
Bought by
Rosen Allen H
Purchase Details
Closed on
Oct 19, 2001
Sold by
Rosen Allen
Bought by
Rosen Allen H
Purchase Details
Closed on
Oct 17, 2001
Sold by
Rosen Simy
Bought by
Rosen Allen
Purchase Details
Closed on
Oct 10, 2001
Sold by
Jackson Yuko S
Bought by
Rosen Allen
Create a Home Valuation Report for This Property
The Home Valuation Report is an in-depth analysis detailing your home's value as well as a comparison with similar homes in the area
Home Values in the Area
Average Home Value in this Area
Purchase History
| Date | Buyer | Sale Price | Title Company |
|---|---|---|---|
| Smith Harris S | -- | None Available | |
| Smith Harris S | -- | None Available | |
| Rosen Dale Clark | -- | None Available | |
| Rosen Allen H | -- | Fidelity National Title Co | |
| Rosen Allen H | -- | Fidelity National Title Co | |
| Rosen Allen H | -- | Fidelity National Title Co | |
| Rosen Allen H | -- | -- | |
| Rosen Allen H | -- | Lawyers Title Company | |
| Rosen Allen H | -- | Lawyers Title Company | |
| Rosen Allen | $428,000 | Lawyers Title | |
| Rosen Allen | $428,000 | Lawyers Title |
Source: Public Records
Tax History
| Year | Tax Paid | Tax Assessment Tax Assessment Total Assessment is a certain percentage of the fair market value that is determined by local assessors to be the total taxable value of land and additions on the property. | Land | Improvement |
|---|---|---|---|---|
| 2025 | $7,530 | $632,264 | $343,757 | $288,507 |
| 2024 | $7,530 | $619,867 | $337,017 | $282,850 |
| 2023 | $7,398 | $607,713 | $330,409 | $277,304 |
| 2022 | $7,187 | $595,798 | $323,931 | $271,867 |
| 2021 | $6,967 | $584,117 | $317,580 | $266,537 |
| 2019 | $6,765 | $566,793 | $308,161 | $258,632 |
| 2018 | $6,493 | $555,680 | $302,119 | $253,561 |
| 2016 | $6,214 | $534,105 | $290,389 | $243,716 |
| 2015 | $5,950 | $526,084 | $286,028 | $240,056 |
| 2014 | -- | $515,780 | $280,426 | $235,354 |
Source: Public Records
Map
Nearby Homes
- 1115 S Elm Dr Unit 301
- 1115 S Elm Dr Unit 417
- 1115 S Elm Dr Unit 207
- 455 S Oakhurst Dr
- 1422 Cardiff Ave
- 434 S Canon Dr Unit 202
- 437 S Doheny Dr
- 1433 S Beverly Dr
- 1225 Smithwood Dr
- 1251 Edris Dr
- 337 S Rexford Dr
- 1257 Edris Dr
- 333 S Rexford Dr
- 432 Smithwood Dr
- 361 S Doheny Dr
- 324 S Elm Dr Unit 101
- 324 S Elm Dr Unit 102
- 9049 Alcott St Unit 204
- 9049 Alcott St Unit 305
- 1278 S Camden Dr Unit 202
- 458 S Rexford Dr Unit C
- 458 S Rexford Dr Unit B
- 458 S Rexford Dr Unit A
- 462 S Rexford Dr
- 450 S Rexford Dr Unit 4
- 450 S Rexford Dr
- 450 S Rexford Dr Unit 6
- 450 S Rexford Dr Unit 2
- 450 S Rexford Dr Unit 7
- 450 S Rexford Dr
- 450 S Rexford Dr Unit 1
- 459 S Maple Dr
- 461 S Maple Dr
- 463 S Maple Dr Unit 4
- 451 S Maple Dr Unit 6
- 451 S Maple Dr Unit 2
- 451 S Maple Dr
- 461 S Rexford Dr
- 459 S Rexford Dr
- 459 S Rexford Dr
Your Personal Tour Guide
Ask me questions while you tour the home.