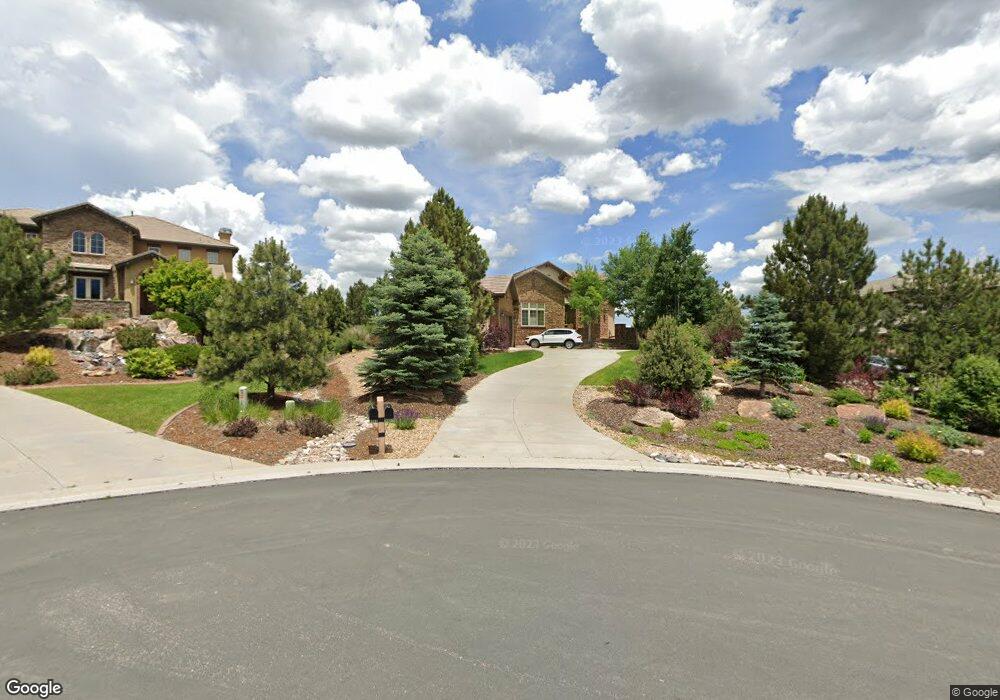
4587 Sonado Place Parker, CO 80134
The Pinery NeighborhoodEstimated Value: $1,325,000 - $1,991,000
4
Beds
5
Baths
5,917
Sq Ft
$280/Sq Ft
Est. Value
About This Home
This home is located at 4587 Sonado Place, Parker, CO 80134 and is currently estimated at $1,659,370, approximately $280 per square foot. 4587 Sonado Place is a home located in Douglas County with nearby schools including Mountain View Elementary School, Northeast Elementary School, and Sagewood Middle School.
Ownership History
Date
Name
Owned For
Owner Type
Purchase Details
Closed on
Jul 28, 2017
Sold by
Bean Rick R and Bean Deborah L
Bought by
Lacey Richard G and Lacey Sara C
Current Estimated Value
Home Financials for this Owner
Home Financials are based on the most recent Mortgage that was taken out on this home.
Original Mortgage
$160,000
Outstanding Balance
$133,327
Interest Rate
3.91%
Mortgage Type
New Conventional
Estimated Equity
$1,526,043
Purchase Details
Closed on
Apr 24, 2008
Sold by
Bainbridge Inc
Bought by
Bean Rick R and Bean Deborah L
Home Financials for this Owner
Home Financials are based on the most recent Mortgage that was taken out on this home.
Original Mortgage
$807,200
Interest Rate
5.87%
Mortgage Type
Unknown
Purchase Details
Closed on
Nov 30, 2006
Sold by
Kdb Homes Inc
Bought by
Bainbridge Inc
Create a Home Valuation Report for This Property
The Home Valuation Report is an in-depth analysis detailing your home's value as well as a comparison with similar homes in the area
Home Values in the Area
Average Home Value in this Area
Purchase History
| Date | Buyer | Sale Price | Title Company |
|---|---|---|---|
| Lacey Richard G | $980,000 | Land Title Guarantee Co | |
| Bean Rick R | $1,009,000 | Land Title Guarantee Company | |
| Bainbridge Inc | $365,600 | -- |
Source: Public Records
Mortgage History
| Date | Status | Borrower | Loan Amount |
|---|---|---|---|
| Open | Lacey Richard G | $160,000 | |
| Previous Owner | Bean Rick R | $807,200 |
Source: Public Records
Tax History Compared to Growth
Tax History
| Year | Tax Paid | Tax Assessment Tax Assessment Total Assessment is a certain percentage of the fair market value that is determined by local assessors to be the total taxable value of land and additions on the property. | Land | Improvement |
|---|---|---|---|---|
| 2024 | $13,108 | $110,090 | $21,900 | $88,190 |
| 2023 | $13,419 | $110,090 | $21,900 | $88,190 |
| 2022 | $10,766 | $77,820 | $13,860 | $63,960 |
| 2021 | $10,845 | $77,820 | $13,860 | $63,960 |
| 2020 | $9,808 | $72,160 | $15,630 | $56,530 |
| 2019 | $9,837 | $72,160 | $15,630 | $56,530 |
| 2018 | $9,804 | $71,200 | $12,390 | $58,810 |
| 2017 | $9,359 | $71,200 | $12,390 | $58,810 |
| 2016 | $9,187 | $67,660 | $11,140 | $56,520 |
| 2015 | $4,826 | $67,660 | $11,140 | $56,520 |
| 2014 | $4,167 | $56,070 | $6,690 | $49,380 |
Source: Public Records
Map
Nearby Homes
- 4616 Sonado Place
- 5608 Raintree Dr
- 4880 Crescent Moon Place
- 5128 Soledad Cir
- 6233 Crowfoot Valley Rd
- 5625 Twilight Way
- 17100 Rose Mallow Ave
- 14425 Hop Clover St
- 14395 Hop Clover St
- 14423 Shasta Daisy Ln
- 14317 Shasta Daisy Point
- 5578 Loma Vista Dr
- 5672 Vistancia Ct
- 14300 Hop Clover St
- 14290 Hop Clover St
- 5334 Sedona Dr
- 5349 Rustler Trail
- 5053 N Crowfoot Valley Rd
- 13978 Wild Lupine St
- 13801 Daffodil Way
- 4563 Sonado Place
- 4609 Sonado Place
- 4562 Sonado Place
- 4631 Sonado Place
- 4586 Sonado Place
- 4646 Sonado Place
- 4671 Sonado Place
- 4668 Bandera Place
- 4670 Sonado Place
- 4682 Bandera Place
- 4582 Wildgrass Place
- 4701 Sonado Place
- 4660 Bandera Place
- 4698 Bandera Place
- 4704 Sonado Place
- 4600 Wildgrass Place
- 4645 Wildgrass Place
- 4709 Sonado Place
- 4675 Bandera Place
- 4620 Wildgrass Place