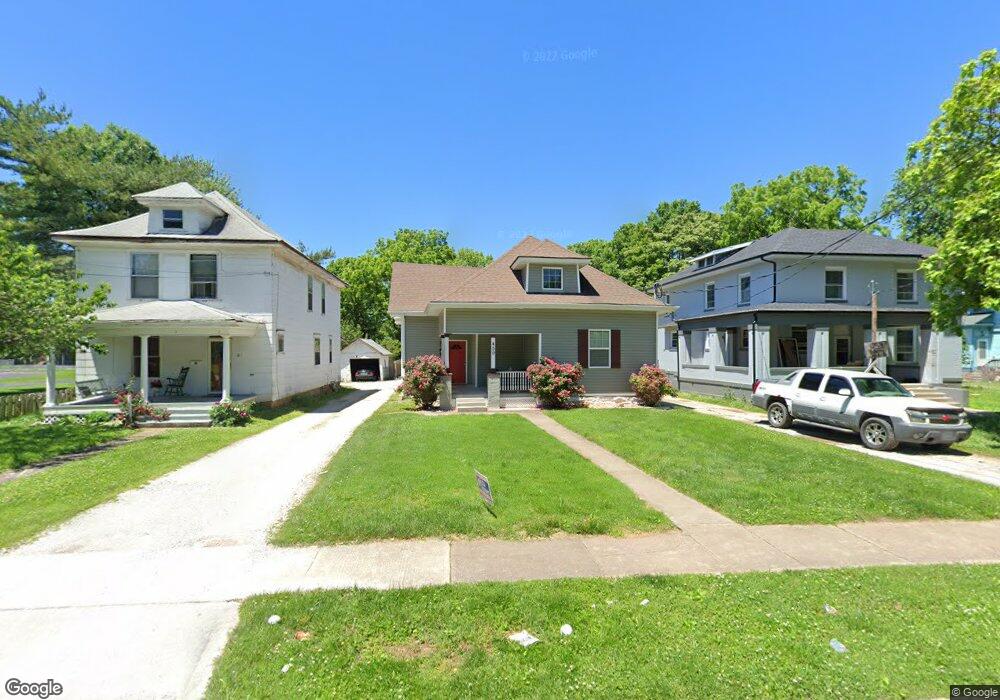
459 S Main Ave Springfield, MO 65806
West Central NeighborhoodEstimated Value: $244,000 - $281,285
6
Beds
4
Baths
1,934
Sq Ft
$136/Sq Ft
Est. Value
About This Home
This home is located at 459 S Main Ave, Springfield, MO 65806 and is currently estimated at $263,571, approximately $136 per square foot. 459 S Main Ave is a home located in Greene County with nearby schools including McGregor Elementary, Parkview High School, and St. Agnes Cathedral School.
Ownership History
Date
Name
Owned For
Owner Type
Purchase Details
Closed on
Mar 28, 2017
Sold by
Family Home Solout Uions Of Southwest Mi
Bought by
Main 459 Llc
Current Estimated Value
Home Financials for this Owner
Home Financials are based on the most recent Mortgage that was taken out on this home.
Original Mortgage
$80,000
Outstanding Balance
$66,499
Interest Rate
4.17%
Mortgage Type
Purchase Money Mortgage
Estimated Equity
$197,072
Create a Home Valuation Report for This Property
The Home Valuation Report is an in-depth analysis detailing your home's value as well as a comparison with similar homes in the area
Home Values in the Area
Average Home Value in this Area
Purchase History
| Date | Buyer | Sale Price | Title Company |
|---|---|---|---|
| Main 459 Llc | -- | None Available | |
| Family Home Solutions Of Southwest Misso | -- | None Available |
Source: Public Records
Mortgage History
| Date | Status | Borrower | Loan Amount |
|---|---|---|---|
| Open | Main 459 Llc | $80,000 |
Source: Public Records
Tax History
| Year | Tax Paid | Tax Assessment Tax Assessment Total Assessment is a certain percentage of the fair market value that is determined by local assessors to be the total taxable value of land and additions on the property. | Land | Improvement |
|---|---|---|---|---|
| 2025 | $1,822 | $36,580 | $4,050 | $32,530 |
| 2024 | $1,577 | $29,390 | $1,650 | $27,740 |
| 2023 | $1,568 | $29,390 | $1,650 | $27,740 |
| 2022 | $1,384 | $25,340 | $1,650 | $23,690 |
| 2021 | $1,384 | $25,340 | $1,650 | $23,690 |
| 2020 | $1,400 | $24,510 | $2,010 | $22,500 |
| 2019 | $1,360 | $24,510 | $2,010 | $22,500 |
| 2018 | $1,352 | $24,370 | $2,010 | $22,360 |
| 2017 | $523 | $8,770 | $2,010 | $6,760 |
| 2016 | $481 | $8,770 | $2,010 | $6,760 |
| 2015 | $476 | $8,770 | $2,010 | $6,760 |
| 2014 | $400 | $7,310 | $2,010 | $5,300 |
Source: Public Records
Map
Nearby Homes
- 723 W Mount Vernon St
- 623 W Walnut St Unit 206
- 623 W Walnut St Unit 408
- 620 S Douglas Ave
- 812 W Pershing St
- 802 W Mount Vernon St
- 824 W Elm St
- 817 W Walnut St
- 840 W Elm St
- 823 W Walnut St
- 630 W State St
- 816 W State St
- 222 N 8th Ave W
- 742 S Douglas Ave
- 509 W Olive St Unit 201
- 509 W Olive St Unit 206
- 739 S Douglas Ave
- 924 W College St
- 327 E Walnut St Unit 203
- 411 W Page St
- 461 S Main Ave
- 467 S Main Ave
- 445 S Main Ave
- 437 S Main Ave
- 460 S Grant Ave
- 513 S Main Ave
- 500 S Main Ave
- 460 S Main Ave
- 454 S Main Ave
- 433 S Main Ave
- 446 S Grant Ave
- 464 S Main Ave
- 448 S Main Ave
- 448 S Grant Ave
- 519 S Main Ave
- 440 S Main Ave
- 504 S Main Ave
- 436 S Main Ave
- 512 S Main Ave
- 512 S Main Ave Unit A
Your Personal Tour Guide
Ask me questions while you tour the home.