Estimated Value: $272,902 - $430,000
1
Bed
1
Bath
576
Sq Ft
$608/Sq Ft
Est. Value
About This Home
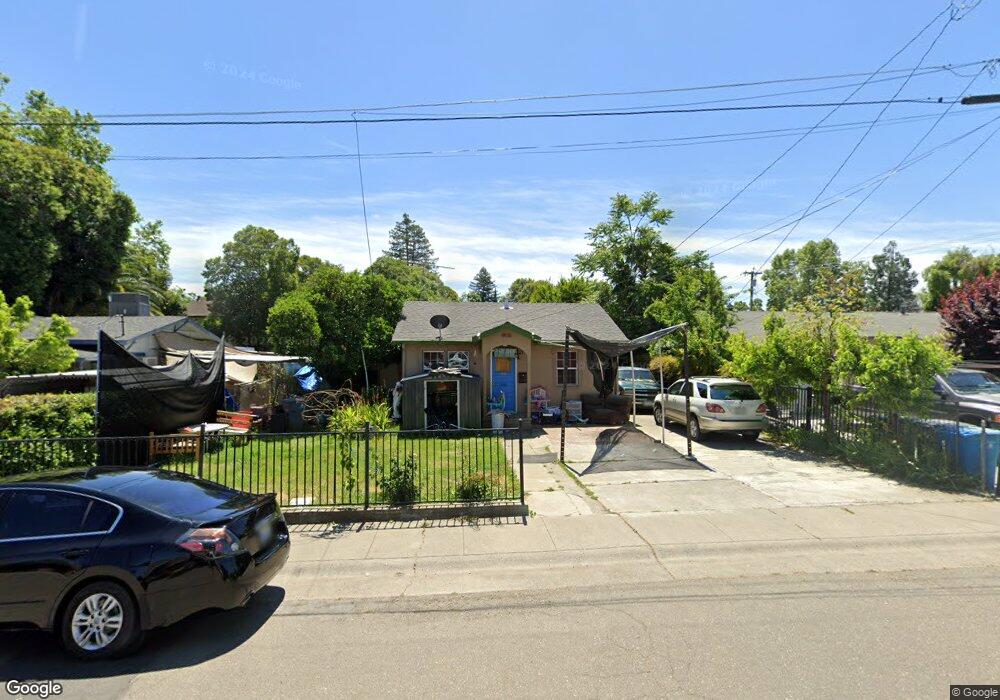
This home is located at 459 W D St, Dixon, CA 95620 and is currently estimated at $350,226, approximately $608 per square foot. 459 W D St is a home located in Solano County with nearby schools including Anderson (Linford L.) Elementary School, Dixon High School, and Dixon Montessori Charter.
Ownership History
Date
Name
Owned For
Owner Type
Purchase Details
Closed on
Feb 17, 2023
Sold by
Ramirez Jesus Martin
Bought by
Jesus Martin Living Trust
Current Estimated Value
Purchase Details
Closed on
Oct 20, 1995
Sold by
Teague Helen A and Huxel Maria Anderson
Bought by
Martin Jesus and Martin Juana
Home Financials for this Owner
Home Financials are based on the most recent Mortgage that was taken out on this home.
Original Mortgage
$57,600
Interest Rate
7.59%
Create a Home Valuation Report for This Property
The Home Valuation Report is an in-depth analysis detailing your home's value as well as a comparison with similar homes in the area
Home Values in the Area
Average Home Value in this Area
Purchase History
| Date | Buyer | Sale Price | Title Company |
|---|---|---|---|
| Jesus Martin Living Trust | -- | -- | |
| Martin Jesus | $72,000 | Placer Title Company |
Source: Public Records
Mortgage History
| Date | Status | Borrower | Loan Amount |
|---|---|---|---|
| Previous Owner | Martin Jesus | $57,600 |
Source: Public Records
Tax History
| Year | Tax Paid | Tax Assessment Tax Assessment Total Assessment is a certain percentage of the fair market value that is determined by local assessors to be the total taxable value of land and additions on the property. | Land | Improvement |
|---|---|---|---|---|
| 2025 | $1,256 | $119,602 | $74,754 | $44,848 |
| 2024 | $1,256 | $117,258 | $73,289 | $43,969 |
| 2023 | $1,217 | $114,959 | $71,852 | $43,107 |
| 2022 | $1,198 | $112,706 | $70,444 | $42,262 |
| 2021 | $1,182 | $110,497 | $69,063 | $41,434 |
| 2020 | $1,162 | $109,365 | $68,355 | $41,010 |
| 2019 | $1,139 | $107,221 | $67,015 | $40,206 |
| 2018 | $1,133 | $105,119 | $65,701 | $39,418 |
| 2017 | $1,104 | $103,059 | $64,413 | $38,646 |
| 2016 | $1,046 | $101,039 | $63,150 | $37,889 |
| 2015 | $1,021 | $99,522 | $62,202 | $37,320 |
| 2014 | $1,009 | $97,573 | $60,984 | $36,589 |
Source: Public Records
Map
Nearby Homes
Your Personal Tour Guide
Ask me questions while you tour the home.