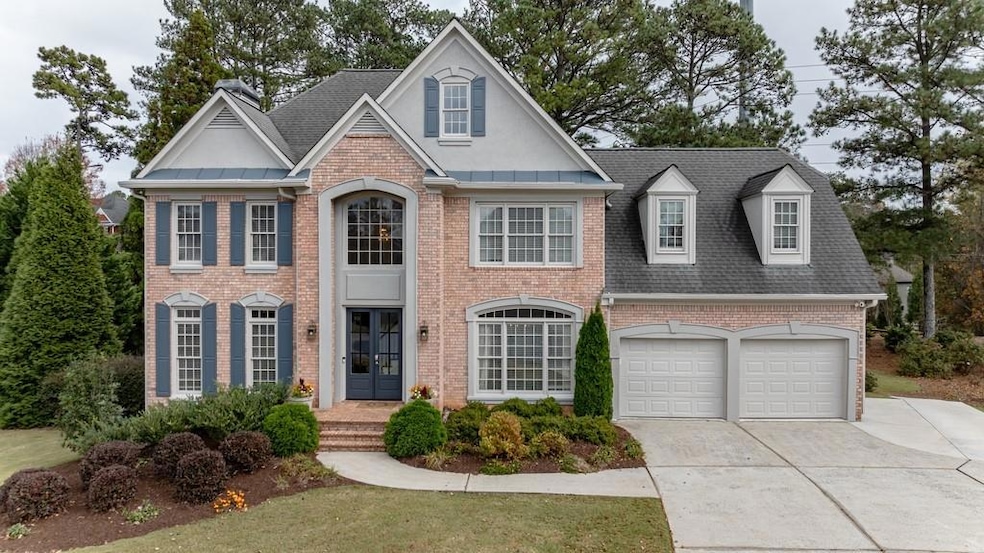
4599 Lasalle Ct Unit 8A Marietta, GA 30062
East Cobb NeighborhoodEstimated payment $5,565/month
Highlights
- Fitness Center
- Community Dry Dock
- Separate his and hers bathrooms
- Mount Bethel Elementary School Rated A
- Fishing
- 4-minute walk to East Hampton Recreation Center
About This Home
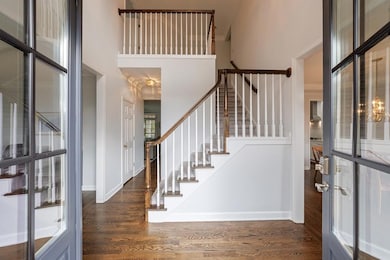
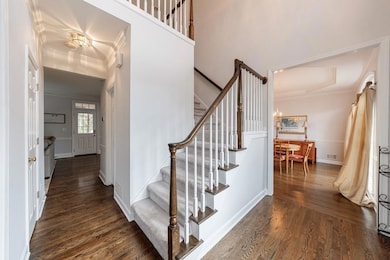
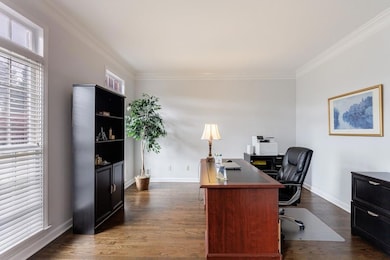
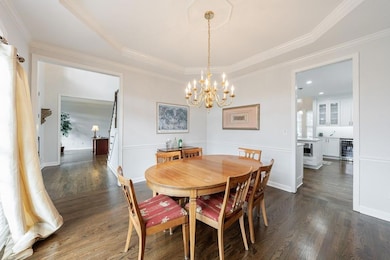
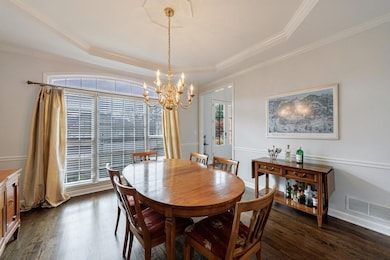
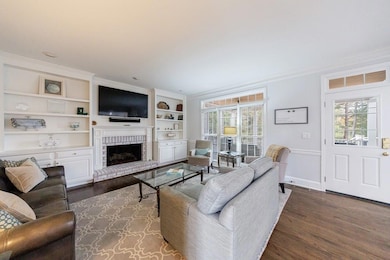
Welcome to this stunning 4 Bedroom, 2.5 Bath home in the desirable Easthampton subdivision. Cul-de-sac lot with impeccable curb appeal and a newly painted exterior. Step inside through custom double doors into an inviting 2-story foyer. The main floor boasts warm hardwood floors, a beautiful recently remodeled kitchen with breakfast nook ready for hosting. The kitchen features double ovens, a large center island, walk-in pantry, stone countertops, and a view to the family room for easy entertaining. Large dining room is located directly off the kitchen. Main floor office for the convenience of working from home. The owner's suite offers a private, updated bath with separate vanities, walk in shower, whirlpool tub, and walk in closets. Generously sized secondary bedrooms provide plenty of comfort and flexibility. Relax or entertain on the new back deck with grilling station, overlooking the large, level backyard. Partially finished basement leaves room for growth with plumbing ready to go! New HVAC's and water heater for peace of mind. Top-rated school district: Mount Bethel ES, Dodgen MS, Walton HS. Fantastic community amenities include fishing lake, fitness center, playground, Olympic sized pool with slide, swim team, tennis courts, and walking sidewalks throughout the neighborhood.
Home Details
Home Type
- Single Family
Est. Annual Taxes
- $8,198
Year Built
- Built in 1996
Lot Details
- 0.5 Acre Lot
- Property fronts a private road
- Private Entrance
- Landscaped
- Level Lot
- Irrigation Equipment
- Front and Back Yard Sprinklers
- Private Yard
- Back and Front Yard
HOA Fees
- $129 Monthly HOA Fees
Parking
- 2 Car Garage
- Front Facing Garage
- Garage Door Opener
- Driveway
Home Design
- Traditional Architecture
- Brick Exterior Construction
- Shingle Roof
- Concrete Perimeter Foundation
- Stucco
Interior Spaces
- 3,196 Sq Ft Home
- 3-Story Property
- Rear Stairs
- Bookcases
- Tray Ceiling
- Ceiling Fan
- Recessed Lighting
- Gas Log Fireplace
- Brick Fireplace
- Two Story Entrance Foyer
- Great Room
- Dining Room Seats More Than Twelve
- Breakfast Room
- Formal Dining Room
- Home Office
Kitchen
- Open to Family Room
- Breakfast Bar
- Walk-In Pantry
- Double Self-Cleaning Oven
- Gas Range
- Range Hood
- Microwave
- Dishwasher
- Kitchen Island
- Stone Countertops
- White Kitchen Cabinets
- Disposal
Flooring
- Wood
- Carpet
Bedrooms and Bathrooms
- 4 Bedrooms
- Dual Closets
- Walk-In Closet
- Separate his and hers bathrooms
- Whirlpool Bathtub
- Separate Shower in Primary Bathroom
- Double Shower
Laundry
- Laundry Room
- Laundry in Hall
- Laundry on upper level
- Dryer
- Washer
- 220 Volts In Laundry
Attic
- Attic Fan
- Pull Down Stairs to Attic
Basement
- Walk-Out Basement
- Partial Basement
- Interior and Exterior Basement Entry
- Stubbed For A Bathroom
- Natural lighting in basement
Outdoor Features
- Deck
- Enclosed Patio or Porch
- Outdoor Storage
Schools
- Mount Bethel Elementary School
- Dodgen Middle School
- Walton High School
Utilities
- Forced Air Zoned Heating and Cooling System
- Underground Utilities
- 220 Volts
- 220 Volts in Garage
- Gas Water Heater
- Phone Available
- Cable TV Available
Listing and Financial Details
- Tax Lot 26
- Assessor Parcel Number 01001800460
Community Details
Overview
- Access Management Association, Phone Number (678) 710-6220
- Easthampton Subdivision
- Community Lake
Amenities
- Clubhouse
Recreation
- Community Dry Dock
- Tennis Courts
- Community Playground
- Swim Team
- Fitness Center
- Community Pool
- Fishing
Map
Home Values in the Area
Average Home Value in this Area
Tax History
| Year | Tax Paid | Tax Assessment Tax Assessment Total Assessment is a certain percentage of the fair market value that is determined by local assessors to be the total taxable value of land and additions on the property. | Land | Improvement |
|---|---|---|---|---|
| 2025 | $8,198 | $316,200 | $70,000 | $246,200 |
| 2024 | $7,252 | $272,276 | $70,000 | $202,276 |
| 2023 | $6,709 | $272,276 | $70,000 | $202,276 |
| 2022 | $6,344 | $228,387 | $36,000 | $192,387 |
| 2021 | $6,344 | $228,387 | $36,000 | $192,387 |
| 2020 | $6,227 | $223,068 | $36,000 | $187,068 |
| 2019 | $6,213 | $222,436 | $68,000 | $154,436 |
| 2018 | $6,213 | $222,436 | $68,000 | $154,436 |
| 2017 | $5,927 | $222,436 | $68,000 | $154,436 |
| 2016 | $5,932 | $222,436 | $68,000 | $154,436 |
| 2015 | $5,373 | $191,224 | $79,200 | $112,024 |
| 2014 | $5,419 | $191,224 | $0 | $0 |
Property History
| Date | Event | Price | List to Sale | Price per Sq Ft |
|---|---|---|---|---|
| 11/14/2025 11/14/25 | For Sale | $900,000 | -- | $282 / Sq Ft |
Purchase History
| Date | Type | Sale Price | Title Company |
|---|---|---|---|
| Deed | $460,000 | -- | |
| Deed | $275,000 | -- | |
| Deed | $265,000 | -- |
Mortgage History
| Date | Status | Loan Amount | Loan Type |
|---|---|---|---|
| Open | $368,000 | New Conventional | |
| Previous Owner | $220,000 | New Conventional | |
| Closed | $0 | No Value Available |
Source: First Multiple Listing Service (FMLS)
MLS Number: 7679761
APN: 01-0018-0-046-0
Disclaimer: Certain information contained herein is derived from information provided by parties other than Homes.com. All information provided is deemed reliable, but is not guaranteed to be accurate and should be independently verified.
![]() Listings identified with the FMLS IDX logo come from FMLS and are held by brokerage firms other than the owner of this website. The listing brokerage is identified in any listing details. Information is deemed reliable but is not guaranteed. If you believe any FMLS listing contains material that infringes your copyrighted work please visit www.fmls.com/dmca to review our DMCA policy and learn how to submit a takedown request. © 2025 First Multiple Listing Service, Inc.
Listings identified with the FMLS IDX logo come from FMLS and are held by brokerage firms other than the owner of this website. The listing brokerage is identified in any listing details. Information is deemed reliable but is not guaranteed. If you believe any FMLS listing contains material that infringes your copyrighted work please visit www.fmls.com/dmca to review our DMCA policy and learn how to submit a takedown request. © 2025 First Multiple Listing Service, Inc.
- 2082 Kinsmon Dr
- 4580 Roswell Rd
- 4804 Dalhousie Place NE
- 4780 Waterhaven Bend
- 4789 Waterhaven Bend
- 4871 Karls Gate Dr
- 2100 Stone Hollow Ct
- 4255 Green Ridge Dr
- 1961 Fields Pond Dr
- 1448 Heritage Glen Dr
- 1804 Shelburne Ridge
- 2281 Fox Hound Pkwy
- 1420 Lafayette Ln
- 5122 Timber Ridge Rd
- 2269 Chimney Springs Dr
- 4586 Hunting Hound Ln
- 4692 Bishop Lake Rd
- 2051 Bishop Creek Dr
- 2163 Heritage Trace Dr
- 1551 Johnson Ferry Rd
- 4198 Lake Rill Ct
- 1386 Heritage Glen Dr
- 2100 Old Forge Way
- 1366 Lake Colony Dr Unit ID1047362P
- 1303 Colony Dr Unit ID1345546P
- 1303 Colony Dr Unit ID1345545P
- 1303 Colony Dr Unit FL1-ID1345544P
- 1303 Colony Dr Unit C
- 1303 Colony Dr
- 4820 Hill Creek Ct
- 5216 Willow Point Pkwy
- 3921 Emerson St
- 1038 Seven Springs Cir
- 3852 Emerson St
- 88 Barrington Oaks Ridge
- 915 Woodlawn Dr NE
