46 Barnard St Buffalo, NY 14206
Kaisertown NeighborhoodEstimated Value: $126,000 - $226,000
6
Beds
2
Baths
2,112
Sq Ft
$87/Sq Ft
Est. Value
About This Home
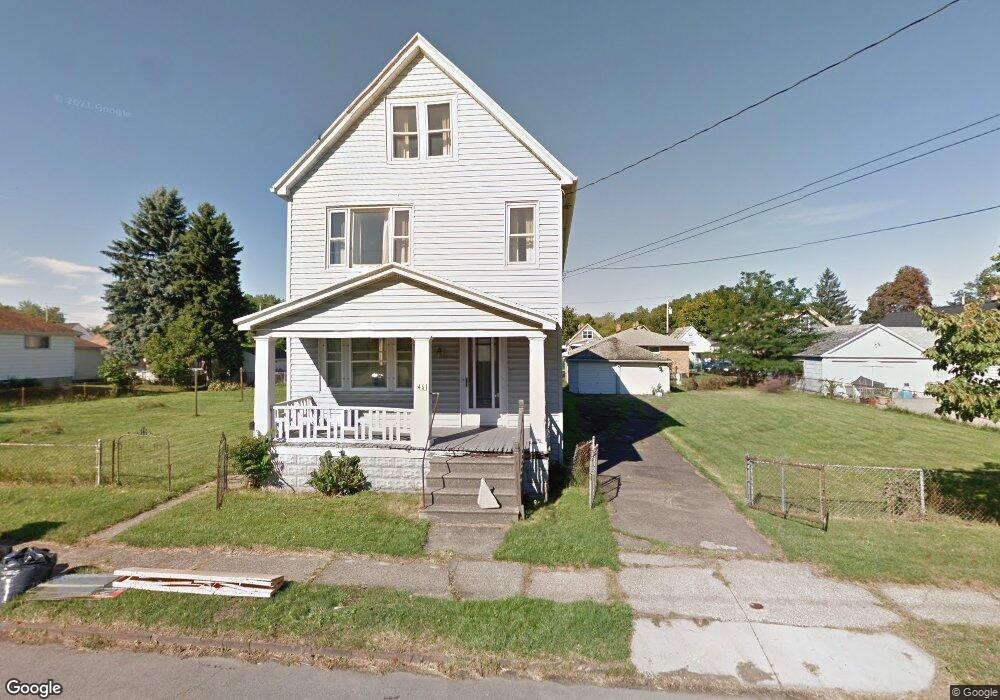
This home is located at 46 Barnard St, Buffalo, NY 14206 and is currently estimated at $183,894, approximately $87 per square foot. 46 Barnard St is a home located in Erie County with nearby schools including South Buffalo Charter School.
Ownership History
Date
Name
Owned For
Owner Type
Purchase Details
Closed on
Aug 30, 2024
Sold by
Brown Andre B
Bought by
Brown Andre B and Brown Rickeyda
Current Estimated Value
Purchase Details
Closed on
May 1, 2024
Sold by
Brown Andre B
Bought by
Brown Andre B
Purchase Details
Closed on
Mar 13, 2015
Home Financials for this Owner
Home Financials are based on the most recent Mortgage that was taken out on this home.
Original Mortgage
$37,895
Interest Rate
3.68%
Mortgage Type
New Conventional
Purchase Details
Closed on
Aug 20, 2014
Sold by
Kehlbeck Barbara and Keller Grace
Bought by
Dyche Daniel
Create a Home Valuation Report for This Property
The Home Valuation Report is an in-depth analysis detailing your home's value as well as a comparison with similar homes in the area
Home Values in the Area
Average Home Value in this Area
Purchase History
| Date | Buyer | Sale Price | Title Company |
|---|---|---|---|
| Brown Andre B | -- | None Available | |
| Brown Andre B | -- | None Available | |
| Brown Andre B | -- | None Available | |
| Brown Andre B | -- | None Available | |
| -- | $55,000 | -- | |
| -- | $55,000 | -- | |
| Dyche Daniel | $7,048 | None Available | |
| Dyche Daniel | $7,048 | None Available |
Source: Public Records
Mortgage History
| Date | Status | Borrower | Loan Amount |
|---|---|---|---|
| Closed | -- | $37,895 |
Source: Public Records
Tax History Compared to Growth
Tax History
| Year | Tax Paid | Tax Assessment Tax Assessment Total Assessment is a certain percentage of the fair market value that is determined by local assessors to be the total taxable value of land and additions on the property. | Land | Improvement |
|---|---|---|---|---|
| 2024 | $398 | $71,000 | $13,000 | $58,000 |
| 2023 | $360 | $71,000 | $13,000 | $58,000 |
| 2022 | $357 | $71,000 | $13,000 | $58,000 |
| 2021 | $357 | $71,000 | $13,000 | $58,000 |
| 2020 | $500 | $71,000 | $13,000 | $58,000 |
| 2019 | $1,783 | $65,000 | $9,600 | $55,400 |
| 2018 | $1,678 | $65,000 | $9,600 | $55,400 |
| 2017 | $387 | $65,000 | $9,600 | $55,400 |
| 2016 | $1,582 | $65,000 | $9,600 | $55,400 |
| 2015 | -- | $65,000 | $9,600 | $55,400 |
| 2014 | -- | $65,000 | $9,600 | $55,400 |
Source: Public Records
Map
Nearby Homes