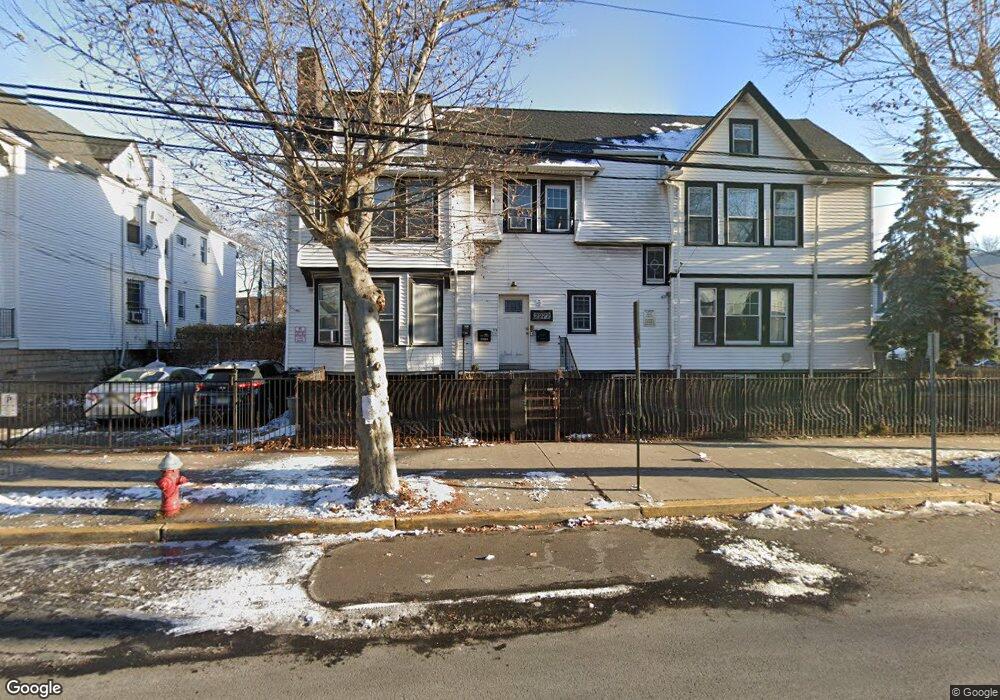
46 Boyd Ave Jersey City, NJ 07304
West Side NeighborhoodEstimated Value: $784,000 - $1,005,000
10
Beds
--
Bath
3,254
Sq Ft
$275/Sq Ft
Est. Value
About This Home
This home is located at 46 Boyd Ave, Jersey City, NJ 07304 and is currently estimated at $895,333, approximately $275 per square foot. 46 Boyd Ave is a home located in Hudson County with nearby schools including Chaplain Charles Watters School, PS #24, Henry Snyder High School, and Lincoln High School.
Ownership History
Date
Name
Owned For
Owner Type
Purchase Details
Closed on
Aug 8, 2011
Sold by
Santiago Catherine and Beltran Matthew
Bought by
Beltran Matthew
Current Estimated Value
Purchase Details
Closed on
Nov 12, 2002
Sold by
Latchman Goolabdai and Vega Goolabdai
Bought by
Beltran Matthew and Beltran Catherine
Home Financials for this Owner
Home Financials are based on the most recent Mortgage that was taken out on this home.
Original Mortgage
$252,000
Interest Rate
5.56%
Mortgage Type
Purchase Money Mortgage
Purchase Details
Closed on
Jun 5, 2001
Sold by
Vega Goolabdai and Ramrup Mayadevi
Bought by
Latchman Goolabdai and Vega Goolabdai
Home Financials for this Owner
Home Financials are based on the most recent Mortgage that was taken out on this home.
Original Mortgage
$160,000
Interest Rate
7.15%
Purchase Details
Closed on
Jun 14, 1995
Sold by
Vega Goolabdai and Ramrup Mayadevi
Bought by
Vega Goolabdai and Ramrup Maydevi
Create a Home Valuation Report for This Property
The Home Valuation Report is an in-depth analysis detailing your home's value as well as a comparison with similar homes in the area
Home Values in the Area
Average Home Value in this Area
Purchase History
| Date | Buyer | Sale Price | Title Company |
|---|---|---|---|
| Beltran Matthew | -- | -- | |
| Beltran Matthew | $285,000 | Lawyers Title Insurance Corp | |
| Latchman Goolabdai | -- | -- | |
| Vega Goolabdai | -- | -- |
Source: Public Records
Mortgage History
| Date | Status | Borrower | Loan Amount |
|---|---|---|---|
| Previous Owner | Beltran Matthew | $252,000 | |
| Previous Owner | Latchman Goolabdai | $160,000 |
Source: Public Records
Tax History Compared to Growth
Tax History
| Year | Tax Paid | Tax Assessment Tax Assessment Total Assessment is a certain percentage of the fair market value that is determined by local assessors to be the total taxable value of land and additions on the property. | Land | Improvement |
|---|---|---|---|---|
| 2025 | $9,276 | $415,400 | $104,000 | $311,400 |
| 2024 | $9,334 | $415,400 | $104,000 | $311,400 |
| 2023 | $9,334 | $415,400 | $104,000 | $311,400 |
| 2022 | $8,798 | $415,400 | $104,000 | $311,400 |
| 2021 | $6,663 | $415,400 | $104,000 | $311,400 |
| 2020 | $6,688 | $415,400 | $104,000 | $311,400 |
| 2019 | $6,397 | $415,400 | $104,000 | $311,400 |
| 2018 | $1,116 | $415,400 | $104,000 | $311,400 |
| 2017 | $5,850 | $75,000 | $6,500 | $68,500 |
| 2016 | $5,776 | $75,000 | $6,500 | $68,500 |
| 2015 | $5,612 | $75,000 | $6,500 | $68,500 |
| 2014 | $5,576 | $88,000 | $6,500 | $81,500 |
Source: Public Records
Map
Nearby Homes
- 36 Boyd Ave
- 2271 John F. Kennedy Blvd Unit 304
- 2380 John F. Kennedy Blvd
- 114 Oak St
- 117 Atlantic St
- 31 Lexington Ave
- 35 Lexington Ave
- 106 Oak St Unit 1
- 77 Lexington Ave
- 86 Clendenny Ave
- 77 Boyd Ave
- 159 Virginia Ave Unit 159A
- 30 Lexington Ave
- 314 Union St
- 68 Lexington Ave
- 186 Union St
- 102 Clendenny Ave
- 628 Bramhall Ave
- 108 Clendenny Ave
- 119 Clendenny Ave Unit 3L
- 42 Boyd Ave
- 2274 John F. Kennedy Blvd
- 40 Boyd Ave
- 2276 John F. Kennedy Blvd
- 38 Boyd Ave
- 2275A John F. Kennedy Blvd Unit 3
- 2275A John F. Kennedy Blvd Unit 2
- 2278 John F. Kennedy Blvd
- 2271 John F. Kennedy Blvd Unit 403
- 2271 John F. Kennedy Blvd Unit 404
- 2271 John F. Kennedy Blvd
- 2271 John F. Kennedy Blvd
- 2271 John F. Kennedy Blvd
- 2271 John F. Kennedy Blvd
- 2271 John F. Kennedy Blvd
- 2271 John F. Kennedy Blvd
- 2271 John F. Kennedy Blvd
- 2271 John F. Kennedy Blvd
- 2271 John F. Kennedy Blvd Unit 401
- 2271 John F. Kennedy Blvd Unit 302