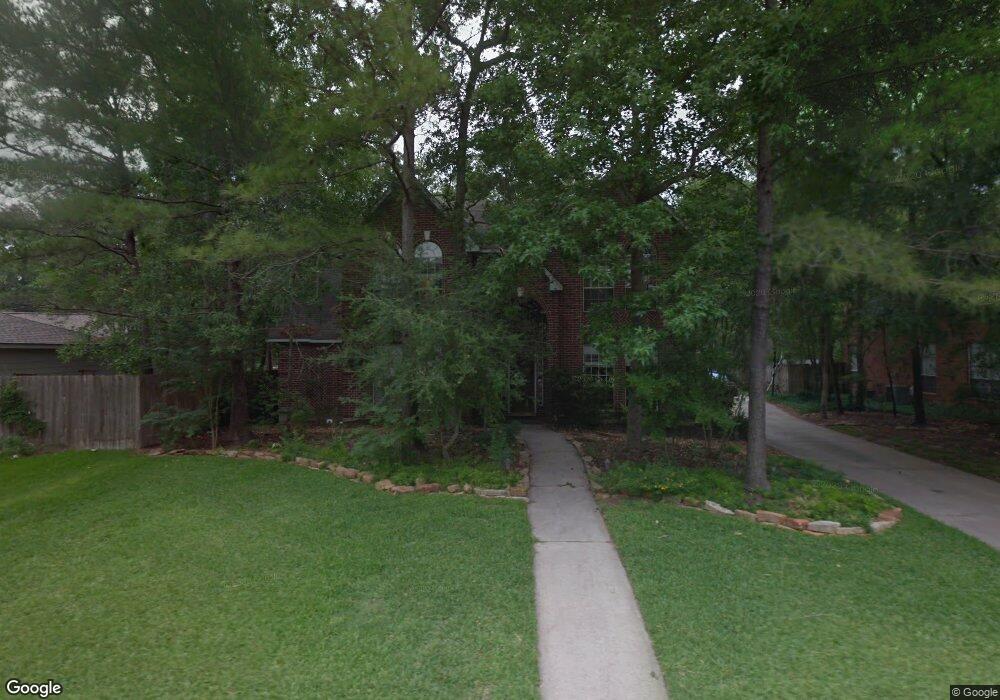
46 Lost Pond Cir Spring, TX 77381
Cochran's Crossing NeighborhoodEstimated Value: $652,878 - $775,000
Studio
4
Baths
2,911
Sq Ft
$238/Sq Ft
Est. Value
About This Home
This home is located at 46 Lost Pond Cir, Spring, TX 77381 and is currently estimated at $693,970, approximately $238 per square foot. 46 Lost Pond Cir is a home located in Montgomery County with nearby schools including Powell Elementary School, Mitchell Intermediate School, and McCullough Junior High School.
Ownership History
Date
Name
Owned For
Owner Type
Purchase Details
Closed on
Nov 15, 2002
Sold by
Williams Jay N and Williams Sandra S
Bought by
Romain John T
Current Estimated Value
Home Financials for this Owner
Home Financials are based on the most recent Mortgage that was taken out on this home.
Original Mortgage
$204,000
Interest Rate
4.87%
Purchase Details
Closed on
Oct 9, 1997
Sold by
Turner Chadwick C and Turner Jill R
Bought by
Williams Jay N and Williams Sandra S
Home Financials for this Owner
Home Financials are based on the most recent Mortgage that was taken out on this home.
Original Mortgage
$204,000
Interest Rate
7.23%
Mortgage Type
Balloon
Purchase Details
Closed on
Jun 25, 1992
Sold by
Weekley Homes Lp
Bought by
Romain John T
Purchase Details
Closed on
Sep 1, 1982
Sold by
Woodlands Land Dev Lp
Bought by
Romain John T
Create a Home Valuation Report for This Property
The Home Valuation Report is an in-depth analysis detailing your home's value as well as a comparison with similar homes in the area
Home Values in the Area
Average Home Value in this Area
Purchase History
We collect this data history from publicly available records. To have your information removed, we recommend requesting removal directly through your county’s website.
| Date | Buyer | Sale Price | Title Company |
|---|---|---|---|
| Romain John T | -- | Stewart Title | |
| Williams Jay N | -- | Alamo Title Company #40 | |
| Romain John T | -- | -- | |
| Romain John T | -- | -- |
Source: Public Records
Mortgage History
We collect this data history from publicly available records. To have your information removed, we recommend requesting removal directly through your county’s website.
| Date | Status | Borrower | Loan Amount |
|---|---|---|---|
| Closed | Romain John T | $204,000 | |
| Previous Owner | Williams Jay N | $204,000 |
Source: Public Records
Tax History
| Year | Tax Paid | Tax Assessment Tax Assessment Total Assessment is a certain percentage of the fair market value that is determined by local assessors to be the total taxable value of land and additions on the property. | Land | Improvement |
|---|---|---|---|---|
| 2025 | $7,216 | $545,516 | -- | -- |
| 2024 | $6,500 | $495,924 | -- | -- |
| 2023 | $6,500 | $450,840 | $90,000 | $469,640 |
| 2022 | $7,936 | $409,850 | $90,000 | $400,290 |
| 2021 | $7,776 | $372,590 | $25,000 | $347,590 |
| 2020 | $7,567 | $345,040 | $25,000 | $320,040 |
| 2019 | $8,792 | $387,860 | $25,000 | $362,860 |
| 2018 | $8,474 | $411,860 | $25,000 | $391,430 |
| 2017 | $8,745 | $374,420 | $25,000 | $349,420 |
| 2016 | $9,104 | $389,810 | $25,000 | $364,810 |
| 2015 | $8,308 | $397,840 | $25,000 | $398,190 |
| 2014 | $8,308 | $361,670 | $25,000 | $336,670 |
Source: Public Records
Map
Nearby Homes
- 34 Lost Pond Cir
- 84 E Stony End Place
- 11 E Summer Storm Cir
- 18 Woodmere Place
- 59 E Rumplecreek Place
- 2 Woodmere Place
- 15 Woodmere Place
- 38 E Summer Storm Cir
- 74 W Summer Storm Cir
- 2 S Duskwood Place
- 31 E Amberglow Cir
- 34 Sweetdream Place
- 30 N Dragonwood Place
- 70 Amberglow Ct
- 27 Summer Haze Cir
- 226 W Stedhill Loop
- 50 E Trillium Cir
- 157 E Summerhaze Cir
- 27 Morning Arbor Place
- 46 E Stedhill Loop
- 42 Lost Pond Cir
- 50 Lost Pond Ct
- 54 Lost Pond Ct
- 38 Lost Pond Cir
- 26 Shooting Star Place
- 23 Flatcreek Place
- 22 Shooting Star Place
- 19 Flatcreek Place
- 58 Lost Pond Ct
- 67 W Lost Pond Cir
- 18 Shooting Star Place
- 22 Flatcreek Place
- 15 Flatcreek Place
- 62 Lost Pond Ct
- 30 Lost Pond Cir
- 18 Flatcreek Place
- 14 Shooting Star Place
- 79 W Lost Pond Cir
- 19 Shooting Star Place
- 11 Flatcreek Place
Your Personal Tour Guide
Ask me questions while you tour the home.