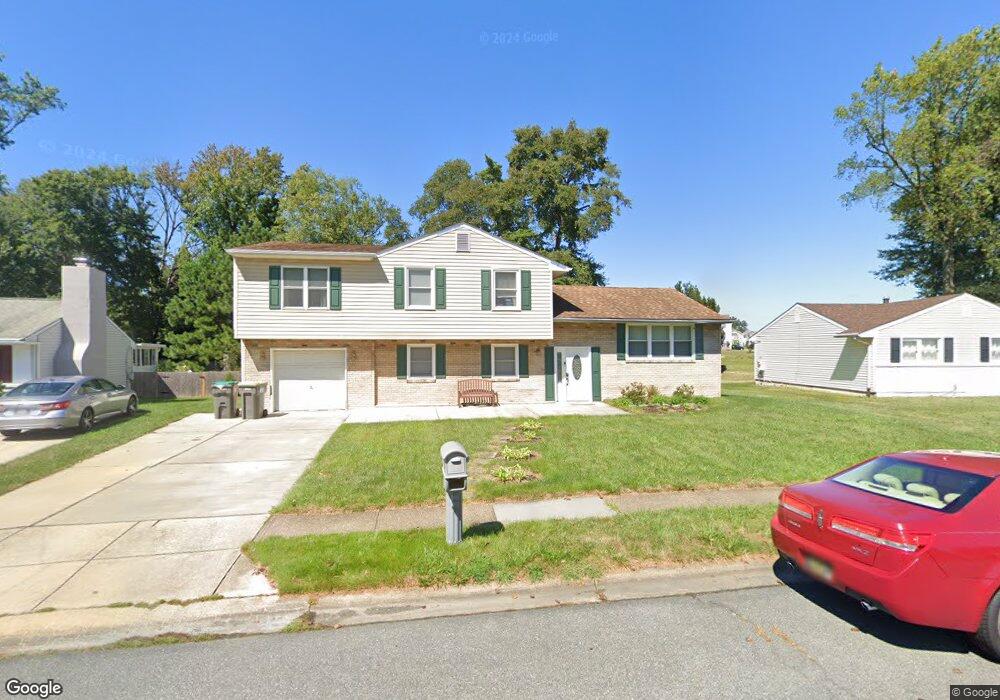
46 N Skyward Dr Newark, DE 19713
Estimated Value: $382,000 - $423,000
4
Beds
3
Baths
1,450
Sq Ft
$281/Sq Ft
Est. Value
About This Home
This home is located at 46 N Skyward Dr, Newark, DE 19713 and is currently estimated at $407,992, approximately $281 per square foot. 46 N Skyward Dr is a home located in New Castle County with nearby schools including Smith (Jennie E.) Elementary School, Gauger-Cobbs Middle School, and Newark High School.
Ownership History
Date
Name
Owned For
Owner Type
Purchase Details
Closed on
Jun 17, 2011
Sold by
Musani Cynthia
Bought by
Riddick Alphonso I and Riddick Tia L
Current Estimated Value
Home Financials for this Owner
Home Financials are based on the most recent Mortgage that was taken out on this home.
Original Mortgage
$216,859
Outstanding Balance
$149,428
Interest Rate
4.62%
Mortgage Type
FHA
Estimated Equity
$258,564
Purchase Details
Closed on
May 26, 2006
Sold by
Gray Albert F and Gray Inez M
Bought by
Musani Karim S and Musani Cynthia
Home Financials for this Owner
Home Financials are based on the most recent Mortgage that was taken out on this home.
Original Mortgage
$199,000
Interest Rate
6.62%
Mortgage Type
Purchase Money Mortgage
Create a Home Valuation Report for This Property
The Home Valuation Report is an in-depth analysis detailing your home's value as well as a comparison with similar homes in the area
Home Values in the Area
Average Home Value in this Area
Purchase History
| Date | Buyer | Sale Price | Title Company |
|---|---|---|---|
| Riddick Alphonso I | $222,500 | None Available | |
| Musani Karim S | $210,250 | None Available |
Source: Public Records
Mortgage History
| Date | Status | Borrower | Loan Amount |
|---|---|---|---|
| Open | Riddick Alphonso I | $216,859 | |
| Previous Owner | Musani Karim S | $199,000 |
Source: Public Records
Tax History Compared to Growth
Tax History
| Year | Tax Paid | Tax Assessment Tax Assessment Total Assessment is a certain percentage of the fair market value that is determined by local assessors to be the total taxable value of land and additions on the property. | Land | Improvement |
|---|---|---|---|---|
| 2024 | $2,975 | $67,700 | $10,900 | $56,800 |
| 2023 | $2,897 | $67,700 | $10,900 | $56,800 |
| 2022 | $2,877 | $67,700 | $10,900 | $56,800 |
| 2021 | $2,816 | $67,700 | $10,900 | $56,800 |
| 2020 | $2,738 | $67,700 | $10,900 | $56,800 |
| 2019 | $2,737 | $67,700 | $10,900 | $56,800 |
| 2018 | $2,374 | $67,700 | $10,900 | $56,800 |
| 2017 | $2,293 | $67,700 | $10,900 | $56,800 |
| 2016 | $2,635 | $67,700 | $10,900 | $56,800 |
| 2015 | $2,080 | $67,700 | $10,900 | $56,800 |
| 2014 | $2,081 | $67,700 | $10,900 | $56,800 |
Source: Public Records
Map
Nearby Homes