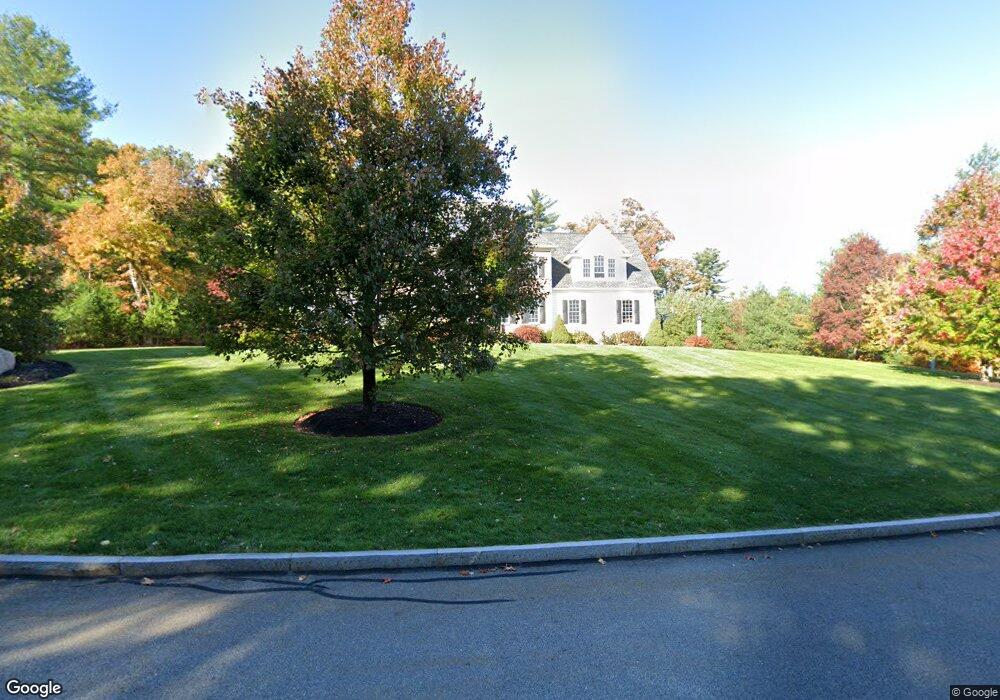
46 Opal Cir Franklin, MA 02038
Wadsworth NeighborhoodEstimated Value: $1,196,000 - $1,370,000
4
Beds
3
Baths
3,968
Sq Ft
$316/Sq Ft
Est. Value
About This Home
This home is located at 46 Opal Cir, Franklin, MA 02038 and is currently estimated at $1,252,893, approximately $315 per square foot. 46 Opal Cir is a home located in Norfolk County with nearby schools including Jefferson Elementary School, Remington Middle School, and Franklin High School.
Ownership History
Date
Name
Owned For
Owner Type
Purchase Details
Closed on
Aug 13, 2019
Sold by
Socci Michael A and Socci Marsha M
Bought by
Socci Opal Circle T
Current Estimated Value
Purchase Details
Closed on
Dec 13, 2011
Sold by
Marsha M Socci Lt
Bought by
Socci Michael A and Socci Marsha M
Home Financials for this Owner
Home Financials are based on the most recent Mortgage that was taken out on this home.
Original Mortgage
$417,000
Interest Rate
4.09%
Purchase Details
Closed on
Aug 9, 2010
Sold by
Socci Michael A and Socci Marsha M
Bought by
Socci Michael A and Socci Marsha M
Purchase Details
Closed on
Oct 10, 2007
Sold by
South Hill Estates Llc
Bought by
Socci Marsha and Socci Michael
Home Financials for this Owner
Home Financials are based on the most recent Mortgage that was taken out on this home.
Original Mortgage
$600,000
Interest Rate
6.49%
Mortgage Type
Purchase Money Mortgage
Create a Home Valuation Report for This Property
The Home Valuation Report is an in-depth analysis detailing your home's value as well as a comparison with similar homes in the area
Home Values in the Area
Average Home Value in this Area
Purchase History
| Date | Buyer | Sale Price | Title Company |
|---|---|---|---|
| Socci Opal Circle T | -- | -- | |
| Socci Michael A | -- | -- | |
| Socci Michael A | -- | -- | |
| Socci Marsha | $315,000 | -- |
Source: Public Records
Mortgage History
| Date | Status | Borrower | Loan Amount |
|---|---|---|---|
| Previous Owner | Socci Michael A | $417,000 | |
| Previous Owner | Socci Marsha | $600,000 |
Source: Public Records
Tax History
| Year | Tax Paid | Tax Assessment Tax Assessment Total Assessment is a certain percentage of the fair market value that is determined by local assessors to be the total taxable value of land and additions on the property. | Land | Improvement |
|---|---|---|---|---|
| 2025 | $12,648 | $1,088,500 | $379,100 | $709,400 |
| 2024 | $13,053 | $1,107,100 | $379,100 | $728,000 |
| 2023 | $12,042 | $957,200 | $322,100 | $635,100 |
| 2022 | $12,565 | $894,300 | $335,500 | $558,800 |
| 2021 | $13,412 | $915,500 | $281,300 | $634,200 |
| 2020 | $12,821 | $883,600 | $281,300 | $602,300 |
| 2019 | $12,901 | $880,000 | $278,400 | $601,600 |
| 2018 | $12,029 | $821,100 | $284,200 | $536,900 |
| 2017 | $12,100 | $829,900 | $293,000 | $536,900 |
| 2016 | $11,381 | $784,900 | $268,700 | $516,200 |
| 2015 | $10,866 | $732,200 | $219,300 | $512,900 |
| 2014 | $10,817 | $748,600 | $235,700 | $512,900 |
Source: Public Records
Map
Nearby Homes
- 9 Reagan Ave
- 900 Washington St Lot 2
- 925 Washington St
- 10 Follett Dr
- 1 Spring St
- 1620 West St
- 18 Bubbling Brook Rd
- 60 Grant Ave
- 9 Brookfield Ln
- 241 Prospect St
- 25 Nature View Dr
- 9 Pebble Cir Unit 9
- 20 Nature View Dr
- 21 Palmetto Dr Unit 21
- 23 Palmetto Dr Unit 23
- 24 Palmetto Dr Unit 24
- 352 Lake St
- 365 W Wrentham Rd
- 172 Pine Swamp Rd
- 180 Pine Swamp Rd
Your Personal Tour Guide
Ask me questions while you tour the home.