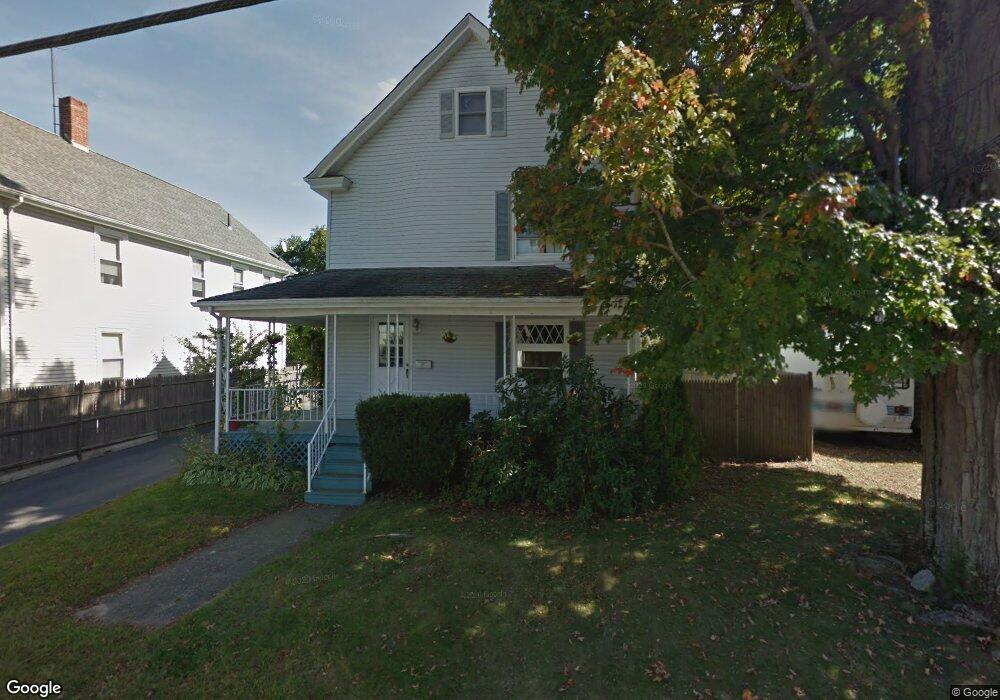
46 Robert St Attleboro, MA 02703
Estimated Value: $457,037 - $531,000
3
Beds
2
Baths
1,811
Sq Ft
$268/Sq Ft
Est. Value
About This Home
This home is located at 46 Robert St, Attleboro, MA 02703 and is currently estimated at $484,759, approximately $267 per square foot. 46 Robert St is a home located in Bristol County with nearby schools including A. Irvin Studley Elementary School, Cyril K. Brennan Middle School, and Attleboro High School.
Ownership History
Date
Name
Owned For
Owner Type
Purchase Details
Closed on
Dec 21, 2020
Sold by
Lingley Jason L
Bought by
Lingley Jason L
Current Estimated Value
Home Financials for this Owner
Home Financials are based on the most recent Mortgage that was taken out on this home.
Original Mortgage
$203,300
Interest Rate
2.73%
Mortgage Type
New Conventional
Purchase Details
Closed on
Jun 28, 2002
Sold by
Johnson Jefrey W and Johnson Diana S
Bought by
Lingley Jason L and Lingley Jill M
Create a Home Valuation Report for This Property
The Home Valuation Report is an in-depth analysis detailing your home's value as well as a comparison with similar homes in the area
Home Values in the Area
Average Home Value in this Area
Purchase History
| Date | Buyer | Sale Price | Title Company |
|---|---|---|---|
| Lingley Jason L | -- | None Available | |
| Lingley Jason L | $217,500 | -- |
Source: Public Records
Mortgage History
| Date | Status | Borrower | Loan Amount |
|---|---|---|---|
| Previous Owner | Lingley Jason L | $203,300 | |
| Previous Owner | Lingley Jason L | $172,500 |
Source: Public Records
Tax History
| Year | Tax Paid | Tax Assessment Tax Assessment Total Assessment is a certain percentage of the fair market value that is determined by local assessors to be the total taxable value of land and additions on the property. | Land | Improvement |
|---|---|---|---|---|
| 2025 | $4,057 | $323,300 | $125,700 | $197,600 |
| 2024 | $3,987 | $313,200 | $125,700 | $187,500 |
| 2023 | $3,663 | $267,600 | $114,200 | $153,400 |
| 2022 | $3,536 | $244,700 | $108,900 | $135,800 |
| 2021 | $1,767 | $261,100 | $104,700 | $156,400 |
| 2020 | $3,796 | $260,700 | $101,600 | $159,100 |
| 2019 | $3,523 | $248,800 | $99,600 | $149,200 |
| 2018 | $1,840 | $222,900 | $96,800 | $126,100 |
| 2017 | $3,274 | $225,000 | $96,800 | $128,200 |
| 2016 | $3,025 | $204,100 | $95,000 | $109,100 |
| 2015 | $2,733 | $185,800 | $95,000 | $90,800 |
| 2014 | $2,652 | $178,600 | $90,500 | $88,100 |
Source: Public Records
Map
Nearby Homes
- 49 Dennis St
- 147 County St
- 17 Crawford Ave
- 75 Dennis St Unit 3
- 21 4th St
- 18-20 Jefferson St
- 17 Jewel Ave
- 64 Mechanic St Unit 3
- 64 Mechanic St
- 46 Berwick Rd
- 17 Capron St
- 0 Rosedale Ln Unit 73469293
- 19 Beech St
- 43 Maple St
- 138 Fisher St Unit A
- 138 Fisher St Unit B
- 61 Pine St Unit 9
- 32 Park St Unit 4
- 28 Pine St Unit C
- 10 John St
- 50 Robert St
- 40 Robert St
- 45 Robert St
- 49 Robert St
- 41 Robert St
- 54 Robert St
- 54 Robert St Unit 2
- 54 Robert St Unit 3
- 53 Robert St
- 56 Robert St
- 15 Summer St
- 57 Robert St
- 19 Summer St
- 60 Robert St
- 9 Summer St
- 21 Summer St
- 21 Summer St
- 21 Summer St Unit 2
- 11 Mary St
- 0 Lot 7 Mary Rocha Way Unit 72589251
Your Personal Tour Guide
Ask me questions while you tour the home.