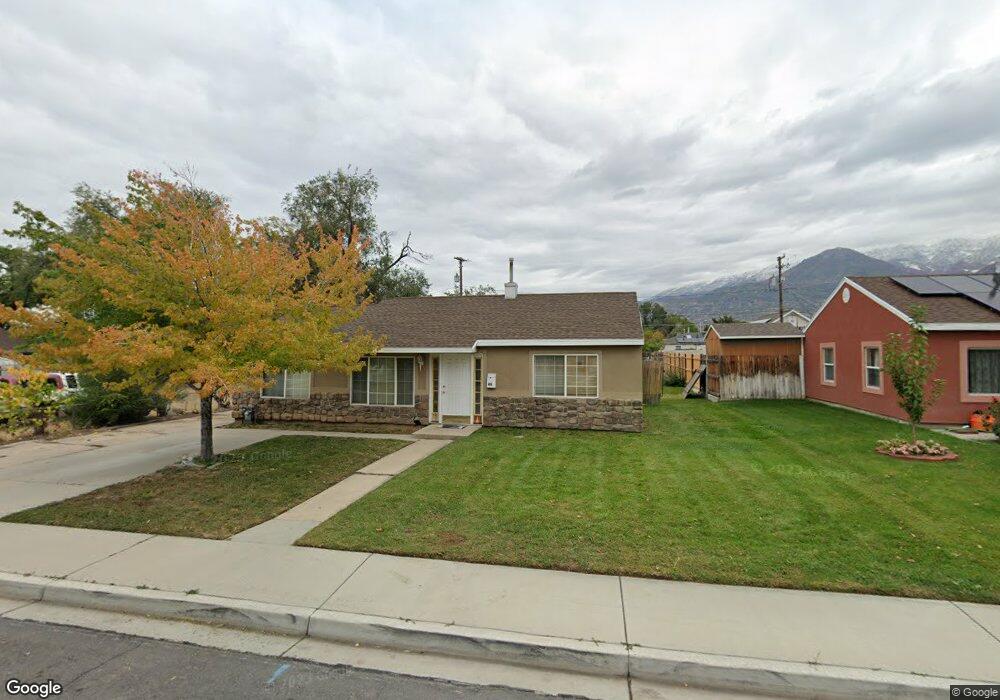
46 W 450 N Orem, UT 84057
Sharon NeighborhoodEstimated Value: $373,000 - $401,000
2
Beds
1
Bath
1,112
Sq Ft
$350/Sq Ft
Est. Value
About This Home
This home is located at 46 W 450 N, Orem, UT 84057 and is currently estimated at $389,129, approximately $349 per square foot. 46 W 450 N is a home located in Utah County with nearby schools including Cascade Elementary School, Canyon View Junior High School, and Orem High School.
Ownership History
Date
Name
Owned For
Owner Type
Purchase Details
Closed on
Aug 1, 2008
Sold by
Northern Utah Properties Lc
Bought by
Mmd Properties Lc
Current Estimated Value
Purchase Details
Closed on
Feb 21, 2006
Sold by
Bjarnson Mark E and Bjarnson Karen J
Bought by
Northern Utah Properties Lc
Create a Home Valuation Report for This Property
The Home Valuation Report is an in-depth analysis detailing your home's value as well as a comparison with similar homes in the area
Home Values in the Area
Average Home Value in this Area
Purchase History
| Date | Buyer | Sale Price | Title Company |
|---|---|---|---|
| Mmd Properties Lc | -- | Us Title Utah | |
| Northern Utah Properties Lc | -- | None Available |
Source: Public Records
Tax History
| Year | Tax Paid | Tax Assessment Tax Assessment Total Assessment is a certain percentage of the fair market value that is determined by local assessors to be the total taxable value of land and additions on the property. | Land | Improvement |
|---|---|---|---|---|
| 2025 | $1,539 | $197,505 | -- | -- |
| 2024 | $1,539 | $188,155 | $0 | $0 |
| 2023 | $1,409 | $185,130 | $0 | $0 |
| 2022 | $1,565 | $199,265 | $0 | $0 |
| 2021 | $1,323 | $255,100 | $137,500 | $117,600 |
| 2020 | $1,189 | $225,300 | $110,000 | $115,300 |
| 2019 | $1,045 | $205,900 | $99,300 | $106,600 |
| 2018 | $963 | $181,400 | $88,700 | $92,700 |
| 2017 | $884 | $89,210 | $0 | $0 |
| 2016 | $844 | $78,485 | $0 | $0 |
| 2015 | $845 | $74,305 | $0 | $0 |
| 2014 | $775 | $67,870 | $0 | $0 |
Source: Public Records
Map
Nearby Homes
- 33 W 400 N
- 369 N Main St Unit 2
- 512 N 100 E
- 171 E 500 N
- 620 N 120 E
- 597 N State St Unit 25
- 241 W 310 St N
- 209 W 205 N
- 285 N 300 W
- 342 W 350 N
- 305 E Elmwood Dr
- 307 E Elmwood Dr
- 156 N 130 E
- 337 Birchwood Dr
- 232 N 250 E
- 241 W Garden Park
- 249 W Garden Park
- 789 200 E Unit 787
- 208 W Garden Park
- 147 N 200 E
Your Personal Tour Guide
Ask me questions while you tour the home.