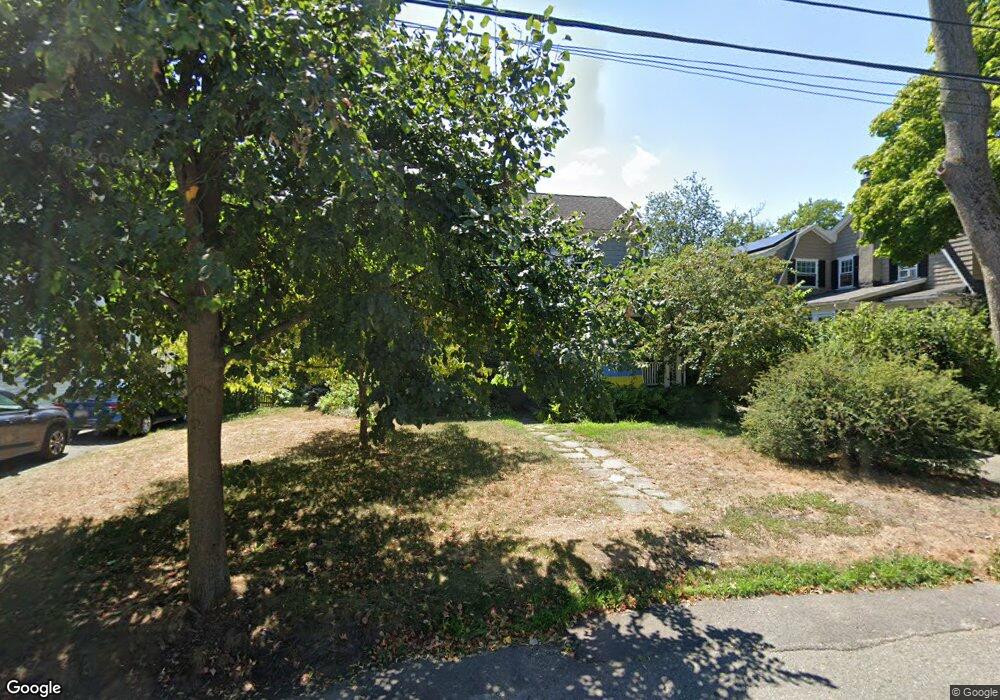
46 Wedgewood Rd West Newton, MA 02465
West Newton NeighborhoodEstimated Value: $1,122,000 - $1,382,455
3
Beds
2
Baths
1,850
Sq Ft
$679/Sq Ft
Est. Value
About This Home
This home is located at 46 Wedgewood Rd, West Newton, MA 02465 and is currently estimated at $1,255,364, approximately $678 per square foot. 46 Wedgewood Rd is a home located in Middlesex County with nearby schools including Franklin Elementary School, Horace Mann Elementary School, and F.A. Day Middle School.
Ownership History
Date
Name
Owned For
Owner Type
Purchase Details
Closed on
Oct 26, 2022
Sold by
Lynch Christopher B
Bought by
Wedgewood Rt
Current Estimated Value
Purchase Details
Closed on
May 14, 1998
Sold by
Ross Audrey C
Bought by
Pitts Eleanor C and Pitts Christopher B
Create a Home Valuation Report for This Property
The Home Valuation Report is an in-depth analysis detailing your home's value as well as a comparison with similar homes in the area
Home Values in the Area
Average Home Value in this Area
Purchase History
| Date | Buyer | Sale Price | Title Company |
|---|---|---|---|
| Wedgewood Rt | -- | None Available | |
| Pitts Eleanor C | $348,000 | -- |
Source: Public Records
Mortgage History
| Date | Status | Borrower | Loan Amount |
|---|---|---|---|
| Previous Owner | Pitts Eleanor C | $257,190 | |
| Previous Owner | Pitts Eleanor C | $235,000 | |
| Previous Owner | Pitts Eleanor C | $244,000 |
Source: Public Records
Tax History Compared to Growth
Tax History
| Year | Tax Paid | Tax Assessment Tax Assessment Total Assessment is a certain percentage of the fair market value that is determined by local assessors to be the total taxable value of land and additions on the property. | Land | Improvement |
|---|---|---|---|---|
| 2025 | $11,017 | $1,124,200 | $813,600 | $310,600 |
| 2024 | $10,653 | $1,091,500 | $789,900 | $301,600 |
| 2023 | $10,061 | $988,300 | $597,900 | $390,400 |
| 2022 | $9,627 | $915,100 | $553,600 | $361,500 |
| 2021 | $9,289 | $863,300 | $522,300 | $341,000 |
| 2020 | $9,013 | $863,300 | $522,300 | $341,000 |
| 2019 | $8,759 | $838,200 | $507,100 | $331,100 |
| 2018 | $8,355 | $772,200 | $459,600 | $312,600 |
| 2017 | $8,101 | $728,500 | $433,600 | $294,900 |
| 2016 | $7,743 | $680,400 | $405,200 | $275,200 |
| 2015 | $7,383 | $635,900 | $378,700 | $257,200 |
Source: Public Records
Map
Nearby Homes
- 27 Cross St Unit 27
- 4 Wiswall St
- 12 Wiswall St
- 321 Albemarle Rd
- 53-55 N Gate Park
- 318 Austin St Unit A
- 41 Kilburn Rd
- 123 Mount Vernon St Unit 2
- 43 Walker St
- 287 Cherry St Unit 2
- 4 Hosmer Cir
- 79 Chestnut St Unit 2
- 371 Cherry St
- 429 Cherry St Unit 11
- 66 Webster St
- 935 Washington St (Rear Facing) Unit 11
- 935 Washington St Unit 8
- 354 Linwood Ave Unit 1
- 2 Elm St Unit 6
- 2 Elm St Unit 8