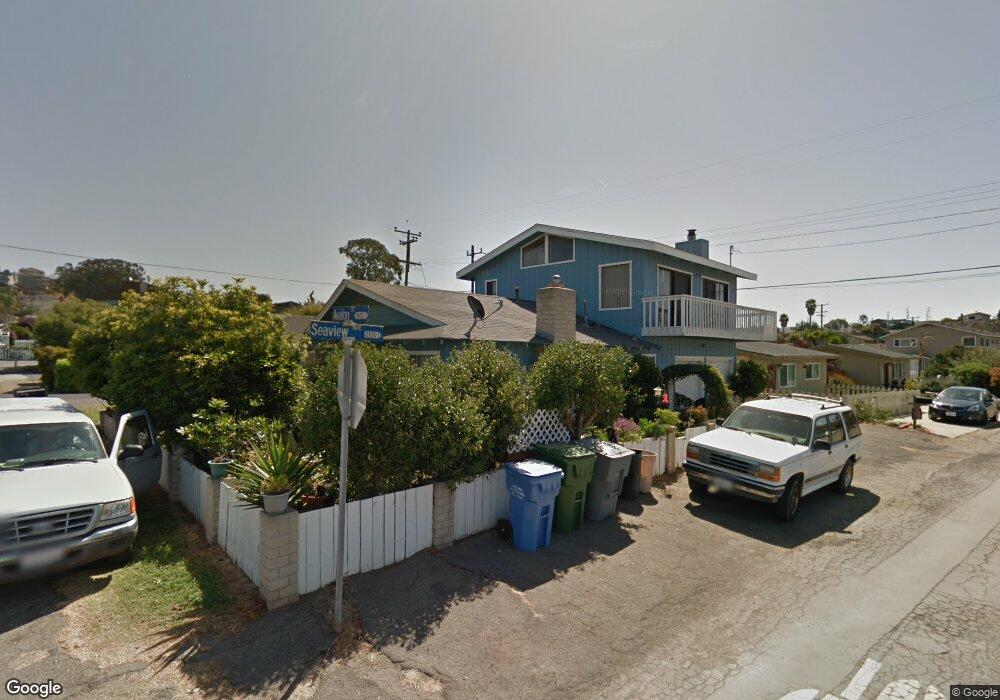
460 Avalon St Unit 1,2 Morro Bay, CA 93442
Estimated Value: $851,000 - $997,686
3
Beds
2
Baths
1,417
Sq Ft
$658/Sq Ft
Est. Value
About This Home
This home is located at 460 Avalon St Unit 1,2, Morro Bay, CA 93442 and is currently estimated at $932,172, approximately $657 per square foot. 460 Avalon St Unit 1,2 is a home located in San Luis Obispo County with nearby schools including Del Mar Elementary School, Los Osos Middle School, and Morro Bay High School.
Ownership History
Date
Name
Owned For
Owner Type
Purchase Details
Closed on
Mar 15, 2017
Sold by
Harris Thomas A
Bought by
Harris Thomas A and Thomas A Harris Living Trust
Current Estimated Value
Purchase Details
Closed on
Mar 23, 2004
Sold by
Chilgren Delia M
Bought by
Harris Thomas A
Home Financials for this Owner
Home Financials are based on the most recent Mortgage that was taken out on this home.
Original Mortgage
$356,000
Outstanding Balance
$162,992
Interest Rate
5.38%
Mortgage Type
Purchase Money Mortgage
Estimated Equity
$769,180
Purchase Details
Closed on
Jan 20, 2000
Sold by
Mealey Richard C and Mealey Julie A
Bought by
Chilgren Delia M
Home Financials for this Owner
Home Financials are based on the most recent Mortgage that was taken out on this home.
Original Mortgage
$163,200
Interest Rate
8.14%
Create a Home Valuation Report for This Property
The Home Valuation Report is an in-depth analysis detailing your home's value as well as a comparison with similar homes in the area
Home Values in the Area
Average Home Value in this Area
Purchase History
| Date | Buyer | Sale Price | Title Company |
|---|---|---|---|
| Harris Thomas A | -- | None Available | |
| Harris Thomas A | $520,000 | Chicago Title Company | |
| Chilgren Delia M | $204,000 | Chicago Title Co |
Source: Public Records
Mortgage History
| Date | Status | Borrower | Loan Amount |
|---|---|---|---|
| Open | Harris Thomas A | $356,000 | |
| Previous Owner | Chilgren Delia M | $163,200 |
Source: Public Records
Tax History
| Year | Tax Paid | Tax Assessment Tax Assessment Total Assessment is a certain percentage of the fair market value that is determined by local assessors to be the total taxable value of land and additions on the property. | Land | Improvement |
|---|---|---|---|---|
| 2025 | $8,010 | $739,315 | $497,618 | $241,697 |
| 2024 | $7,866 | $724,819 | $487,861 | $236,958 |
| 2023 | $7,866 | $710,608 | $478,296 | $232,312 |
| 2022 | $7,373 | $696,675 | $468,918 | $227,757 |
| 2021 | $7,255 | $683,016 | $459,724 | $223,292 |
| 2020 | $7,181 | $676,014 | $455,011 | $221,003 |
| 2019 | $7,106 | $662,760 | $446,090 | $216,670 |
| 2018 | $6,967 | $649,766 | $437,344 | $212,422 |
| 2017 | $6,831 | $637,026 | $428,769 | $208,257 |
| 2016 | $6,697 | $624,536 | $420,362 | $204,174 |
| 2015 | $6,594 | $615,156 | $414,048 | $201,108 |
| 2014 | $6,055 | $603,107 | $405,938 | $197,169 |
Source: Public Records
Map
Nearby Homes
- 540 Avalon St
- 485 Bonita St
- 2581 Juniper Ave
- 2560 Juniper Ave
- 2600 Ironwood Ave
- 0 Atascadero Rd
- 2350 Nutmeg Ave
- 679 Elena St
- 2785 Hemlock Ave
- 2845 Ironwood Ave
- 2783 Coral Ave
- 2900 Alder Ave
- 650 Sequoia Ct
- 313 San Gabriel Ave
- 369 Dunbar St
- 3058 Main St
- 670 Sequoia Ct
- 410 Island St
- 1260 Main St
- 1151 Main St
- 460 Avalon St
- 470 Avalon St
- 2188 2190 Seaview Ave
- 2190 Seaview Ave
- 480 Avalon St
- 2197 Seaview Ave
- 461 Hillview St
- 430 Avalon St
- 465 Avalon St
- 457 Avalon St Unit A &
- 457 Avalon St
- 467 Avalon St
- 449 Hillview St
- 441 Avalon St
- 471 Hillview St
- 471 Avalon St
- 418 Avalon St
- 2188 Seaview Ave
- 500 Avalon St
- 447 Hillview St
Your Personal Tour Guide
Ask me questions while you tour the home.