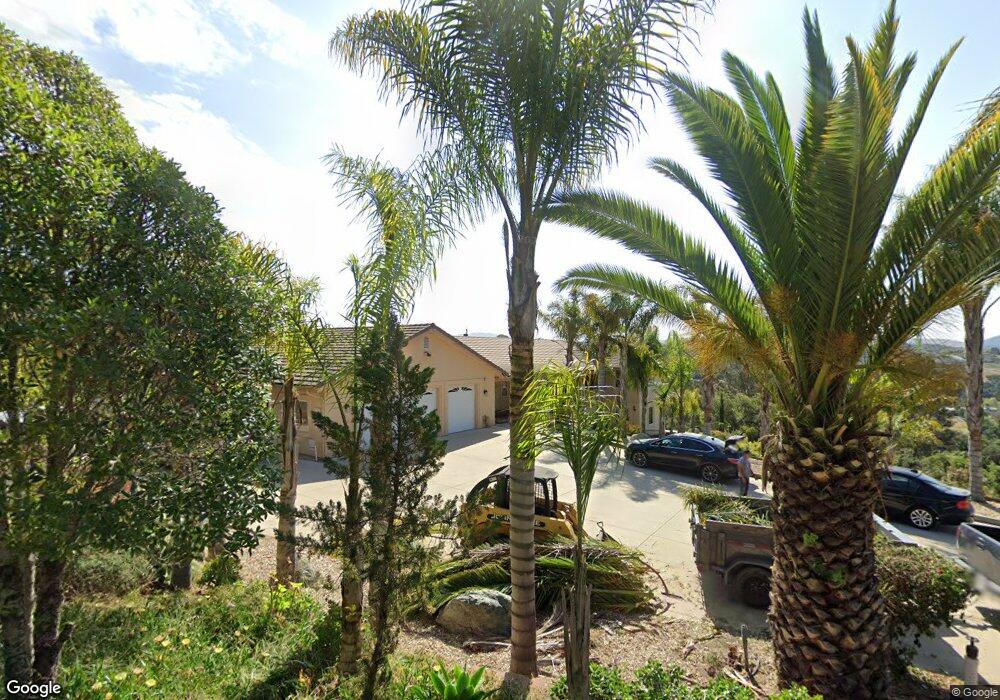
460 Dennis Ln Arroyo Grande, CA 93420
Estimated Value: $2,042,000 - $2,190,000
4
Beds
3
Baths
2,850
Sq Ft
$742/Sq Ft
Est. Value
About This Home
This home is located at 460 Dennis Ln, Arroyo Grande, CA 93420 and is currently estimated at $2,113,679, approximately $741 per square foot. 460 Dennis Ln is a home located in San Luis Obispo County with nearby schools including Judkins Middle School, Arroyo Grande High School, and Coastal Christian School.
Ownership History
Date
Name
Owned For
Owner Type
Purchase Details
Closed on
May 24, 2008
Sold by
Patel Jashvant and Patel Ila J
Bought by
Patel Jashvant G and Patel Ila J
Current Estimated Value
Purchase Details
Closed on
Oct 8, 2002
Sold by
Don Mchaney Realty Inc
Bought by
Patel Jashvant and Patel Ila J
Home Financials for this Owner
Home Financials are based on the most recent Mortgage that was taken out on this home.
Original Mortgage
$534,100
Outstanding Balance
$202,734
Interest Rate
4.87%
Estimated Equity
$1,910,945
Purchase Details
Closed on
Mar 20, 2002
Sold by
Quaresma Family Trust
Bought by
Don Mchaney Realty Inc
Home Financials for this Owner
Home Financials are based on the most recent Mortgage that was taken out on this home.
Original Mortgage
$379,662
Interest Rate
6.84%
Create a Home Valuation Report for This Property
The Home Valuation Report is an in-depth analysis detailing your home's value as well as a comparison with similar homes in the area
Home Values in the Area
Average Home Value in this Area
Purchase History
| Date | Buyer | Sale Price | Title Company |
|---|---|---|---|
| Patel Jashvant G | -- | None Available | |
| Patel Jashvant | $668,000 | Chicago Title Company | |
| Don Mchaney Realty Inc | $80,000 | Chicago Title Co |
Source: Public Records
Mortgage History
| Date | Status | Borrower | Loan Amount |
|---|---|---|---|
| Open | Patel Jashvant | $534,100 | |
| Previous Owner | Don Mchaney Realty Inc | $379,662 | |
| Closed | Don Mchaney Realty Inc | $40,000 | |
| Closed | Patel Jashvant | $66,800 |
Source: Public Records
Tax History Compared to Growth
Tax History
| Year | Tax Paid | Tax Assessment Tax Assessment Total Assessment is a certain percentage of the fair market value that is determined by local assessors to be the total taxable value of land and additions on the property. | Land | Improvement |
|---|---|---|---|---|
| 2025 | $12,168 | $1,183,034 | $514,148 | $668,886 |
| 2024 | $12,029 | $1,159,838 | $504,067 | $655,771 |
| 2023 | $12,029 | $1,137,097 | $494,184 | $642,913 |
| 2022 | $11,848 | $1,114,802 | $484,495 | $630,307 |
| 2021 | $11,826 | $1,092,945 | $474,996 | $617,949 |
| 2020 | $11,691 | $1,081,739 | $470,126 | $611,613 |
| 2019 | $11,619 | $1,060,529 | $460,908 | $599,621 |
| 2018 | $11,481 | $1,039,735 | $451,871 | $587,864 |
| 2017 | $11,266 | $1,019,349 | $443,011 | $576,338 |
| 2016 | $10,625 | $999,363 | $434,325 | $565,038 |
| 2015 | $10,473 | $984,353 | $427,802 | $556,551 |
| 2014 | $10,084 | $965,071 | $419,422 | $545,649 |
Source: Public Records
Map
Nearby Homes
- 249 Margo Way
- 1024 Robin Cir
- 234 Christine Way
- 762 White Oak Blvd
- 515 Windermere Ln
- 747 Vista Pacifica Cir
- 657 Vista Pacifica Cir
- 108 Marian Way
- 601 Vista Pacifica Cir
- 1085 James Way
- 670 Vista Pacifica Cir
- 45 La Gaviota
- 618 Vista Pacifica Cir
- 1057 Meadow Way
- 117 Village Cir
- 649 Asilo
- 60 La Garza
- 2 Paseo Ladera Ln
- 579 Camino Mercado Unit 305
- 207 Princessa Ln
- 495 Dennis Ln
- 480 Dennis Ln
- 1255 Via Privado
- 1230 Via Privado
- 420 Dennis Ln
- 1215 Via Privado
- 334 Pine Tree Ln
- 445 Dennis Ln
- 499 Dennis Ln
- 499 Dennis Ln Unit LOT
- 503 Erhart Rd
- 330 Peace Ln
- 380 Dennis Ln
- 391 Dennis Ln
- 311 Pine Tree Ln
- 507 Erhart Rd
- 1131 Old Oak Park Rd
- 385 Dennis Ln
- 474 Hurley Ranch Rd
- 474 Hurley Ranch Rd