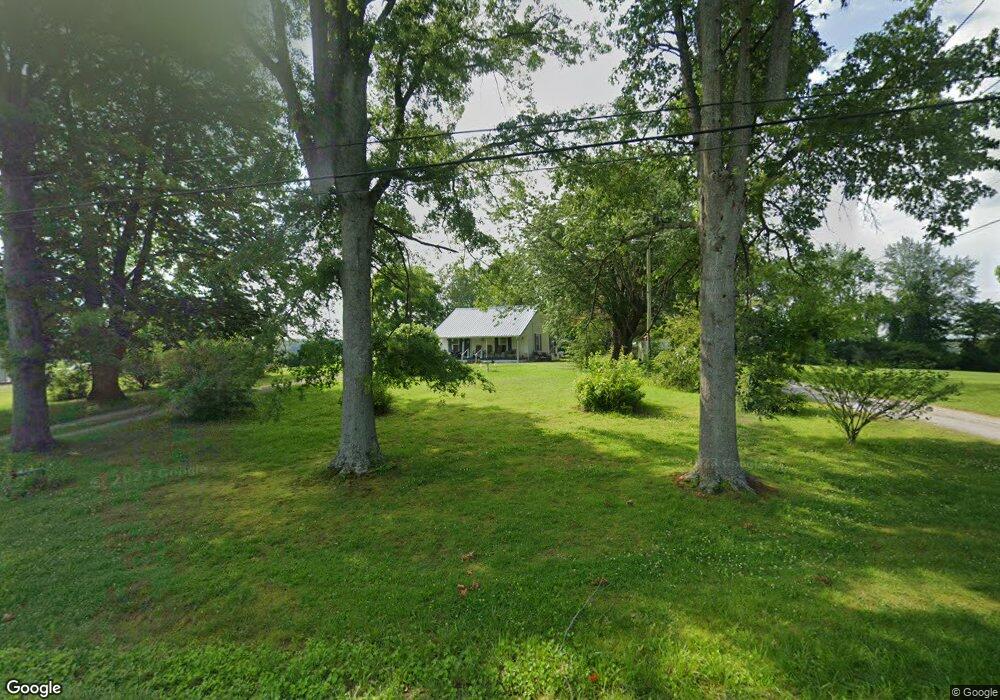
460 E Maple St Morrison, TN 37357
Estimated Value: $102,066 - $173,000
Studio
1
Bath
972
Sq Ft
$152/Sq Ft
Est. Value
About This Home
This home is located at 460 E Maple St, Morrison, TN 37357 and is currently estimated at $147,267, approximately $151 per square foot. 460 E Maple St is a home located in Warren County with nearby schools including Morrison Elementary School and Warren County High School.
Ownership History
Date
Name
Owned For
Owner Type
Purchase Details
Closed on
Feb 22, 2017
Sold by
Troglen Eugene E
Bought by
Pendergrass Sherry and Pendergrass William
Current Estimated Value
Purchase Details
Closed on
Jan 9, 2001
Sold by
Luna Burgess and Luna Janie
Bought by
Troglen Eugene and Troglen Joanie
Purchase Details
Closed on
Dec 26, 2000
Bought by
Luna Burgess W and Luna Janie
Purchase Details
Closed on
Jan 31, 2000
Bought by
Mccormack Brian L and Mccormack Sherry
Purchase Details
Closed on
Jan 9, 2000
Purchase Details
Closed on
Jul 13, 1998
Sold by
Lance Kristi L
Bought by
Luna Burgess W and Luna Janie
Purchase Details
Closed on
Apr 21, 1998
Bought by
Booker Carl and Booker Bettye
Home Financials for this Owner
Home Financials are based on the most recent Mortgage that was taken out on this home.
Original Mortgage
$27,200
Interest Rate
7.03%
Purchase Details
Closed on
Nov 30, 1989
Bought by
Greene Kenneth W
Purchase Details
Closed on
Mar 6, 1986
Bought by
Moore Donald
Purchase Details
Closed on
Dec 22, 1979
Create a Home Valuation Report for This Property
The Home Valuation Report is an in-depth analysis detailing your home's value as well as a comparison with similar homes in the area
Purchase History
| Date | Buyer | Sale Price | Title Company |
|---|---|---|---|
| Pendergrass Sherry | $50,000 | -- | |
| Troglen Eugene | $40,000 | -- | |
| Luna Burgess W | $46,000 | -- | |
| Mccormack Brian L | $46,000 | -- | |
| -- | $40,000 | -- | |
| Luna Burgess W | $47,500 | -- | |
| Booker Carl | $34,000 | -- | |
| Greene Kenneth W | -- | -- | |
| Moore Donald | -- | -- | |
| -- | -- | -- |
Source: Public Records
Mortgage History
| Date | Status | Borrower | Loan Amount |
|---|---|---|---|
| Previous Owner | Not Available | $27,200 |
Source: Public Records
Tax History
| Year | Tax Paid | Tax Assessment Tax Assessment Total Assessment is a certain percentage of the fair market value that is determined by local assessors to be the total taxable value of land and additions on the property. | Land | Improvement |
|---|---|---|---|---|
| 2025 | -- | $24,500 | $6,975 | $17,525 |
| 2024 | -- | $12,150 | $2,675 | $9,475 |
| 2023 | $251 | $12,150 | $2,675 | $9,475 |
| 2022 | $251 | $12,150 | $2,675 | $9,475 |
| 2021 | $251 | $12,150 | $2,675 | $9,475 |
| 2020 | $204 | $12,150 | $2,675 | $9,475 |
| 2019 | $232 | $9,825 | $2,300 | $7,525 |
| 2018 | $204 | $9,825 | $2,300 | $7,525 |
| 2017 | $204 | $9,825 | $2,300 | $7,525 |
| 2016 | $193 | $9,825 | $2,300 | $7,525 |
| 2015 | $207 | $9,825 | $2,300 | $7,525 |
| 2014 | $217 | $9,825 | $2,300 | $7,525 |
| 2013 | $217 | $10,293 | $0 | $0 |
Source: Public Records
Map
Nearby Homes
- 120 Boyd St
- 431 S Fair St
- 511 N Main St
- 101 S Mill St
- 8557 Manchester Hwy
- 631 W Maple St
- 2357 Beacon Light Rd Unit 1
- 2100 Beacon Light Rd Unit 6
- 2100 Beacon Light Rd Unit 4
- 2100 Beacon Light Rd Unit 8
- 2100 Beacon Light Rd
- 2100 Beacon Light Rd Unit 9
- 2357 Beacon Light Rd
- 2100 Beacon Light Rd Unit 3
- 2100 Beacon Light Rd Unit 11
- 2100 Beacon Light Rd Unit 5
- 2100 Beacon Light Rd Unit 10
- 2100 Beacon Light Rd Unit 7
- 2100 Beacon Light Rd Unit 2
- 0 Old Wells Rd
- 440 E Maple St
- 461 E Maple St
- 451 E Maple St
- 471 E Maple St
- 441 E Maple St
- 481 E Maple St
- 431 E Maple St
- 491 E Maple St
- Lot #94 Windswept Way
- 420 E Maple St
- 421 E Maple St
- 411 E Maple St
- 2 Manchester Hwy
- 1 Manchester Hwy
- 330 E Maple St
- 361 E Maple St
- 9800 Manchester Hwy
- 351 E Maple St
- 320 E Maple St
Your Personal Tour Guide
Ask me questions while you tour the home.