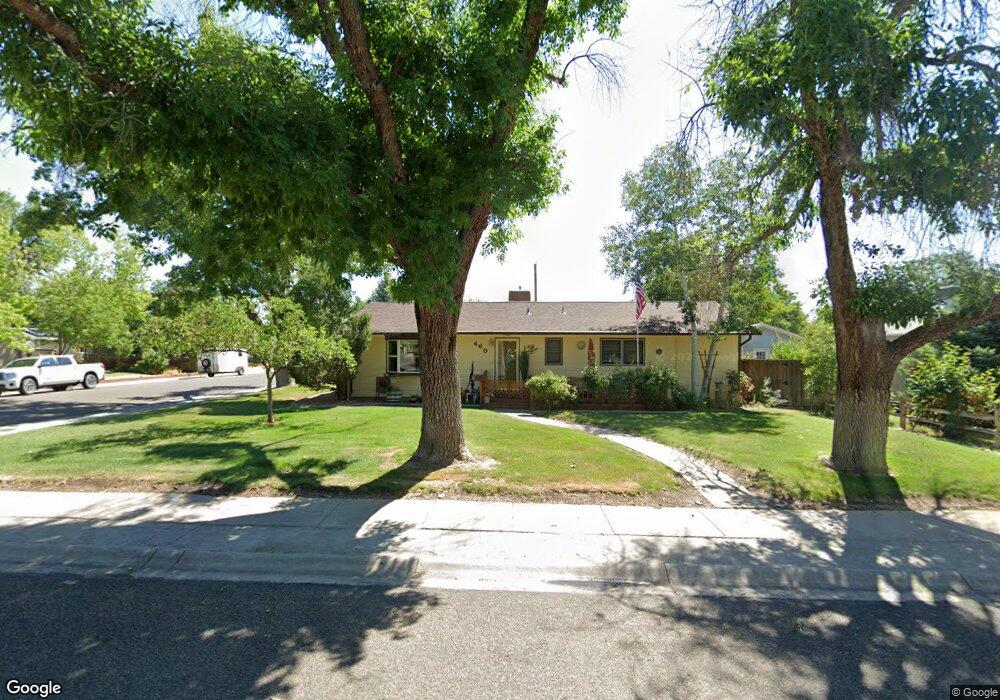
460 N 17th St Grand Junction, CO 81501
Downtown Grand Junction NeighborhoodEstimated Value: $340,000 - $410,000
3
Beds
2
Baths
1,442
Sq Ft
$261/Sq Ft
Est. Value
About This Home
This home is located at 460 N 17th St, Grand Junction, CO 81501 and is currently estimated at $376,545, approximately $261 per square foot. 460 N 17th St is a home located in Mesa County with nearby schools including Chipeta Elementary School, East Middle School, and West Middle School.
Ownership History
Date
Name
Owned For
Owner Type
Purchase Details
Closed on
May 22, 1998
Sold by
King Charles W and King Edith A
Bought by
Leiding James R and Leiding Ida P
Current Estimated Value
Home Financials for this Owner
Home Financials are based on the most recent Mortgage that was taken out on this home.
Original Mortgage
$76,500
Outstanding Balance
$14,961
Interest Rate
7.11%
Estimated Equity
$361,584
Purchase Details
Closed on
Nov 20, 1992
Sold by
King Charles W
Bought by
Leiding James R
Create a Home Valuation Report for This Property
The Home Valuation Report is an in-depth analysis detailing your home's value as well as a comparison with similar homes in the area
Home Values in the Area
Average Home Value in this Area
Purchase History
| Date | Buyer | Sale Price | Title Company |
|---|---|---|---|
| Leiding James R | $85,000 | -- | |
| Leiding James R | -- | -- |
Source: Public Records
Mortgage History
| Date | Status | Borrower | Loan Amount |
|---|---|---|---|
| Open | Leiding James R | $76,500 |
Source: Public Records
Tax History Compared to Growth
Tax History
| Year | Tax Paid | Tax Assessment Tax Assessment Total Assessment is a certain percentage of the fair market value that is determined by local assessors to be the total taxable value of land and additions on the property. | Land | Improvement |
|---|---|---|---|---|
| 2024 | $1,015 | $21,050 | $6,060 | $14,990 |
| 2023 | $1,015 | $21,050 | $6,060 | $14,990 |
| 2022 | $902 | $19,460 | $4,780 | $14,680 |
| 2021 | $906 | $20,030 | $4,920 | $15,110 |
| 2020 | $613 | $16,070 | $4,470 | $11,600 |
| 2019 | $579 | $16,070 | $4,470 | $11,600 |
| 2018 | $472 | $13,340 | $4,050 | $9,290 |
| 2017 | $470 | $13,340 | $4,050 | $9,290 |
| 2016 | $447 | $14,260 | $4,230 | $10,030 |
| 2015 | $453 | $14,260 | $4,230 | $10,030 |
| 2014 | $420 | $13,320 | $3,480 | $9,840 |
Source: Public Records
Map
Nearby Homes