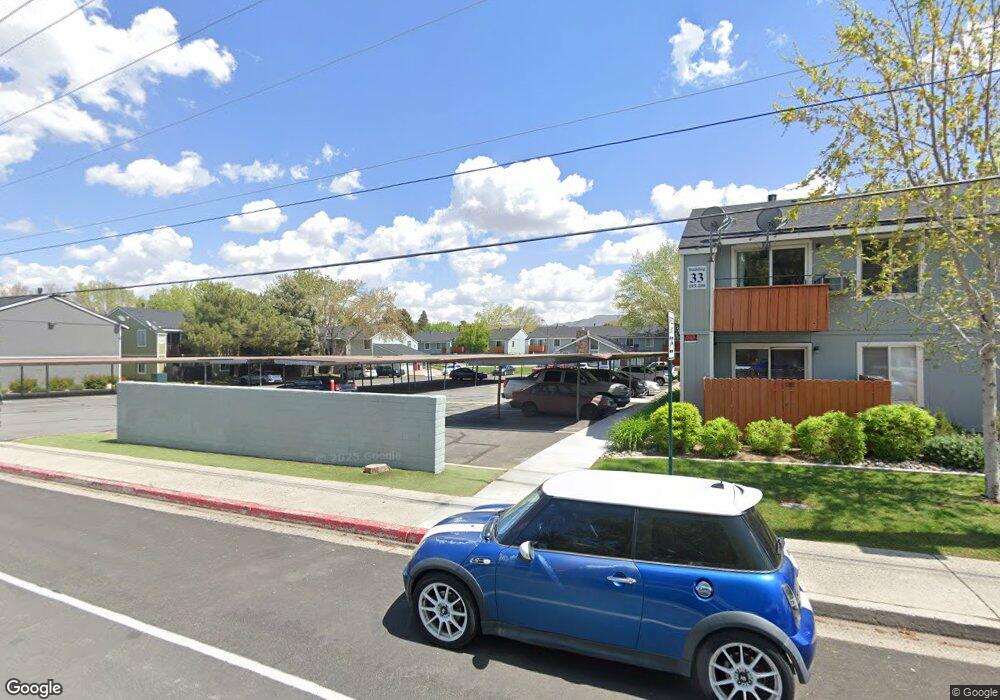
4602 Neil Rd Unit 137 Reno, NV 89502
Smithridge NeighborhoodEstimated Value: $189,154 - $217,000
2
Beds
1
Bath
860
Sq Ft
$237/Sq Ft
Est. Value
About This Home
This home is located at 4602 Neil Rd Unit 137, Reno, NV 89502 and is currently estimated at $204,039, approximately $237 per square foot. 4602 Neil Rd Unit 137 is a home located in Washoe County with nearby schools including Smithridge Elementary School, Edward L Pine Middle School, and Damonte Ranch High School.
Ownership History
Date
Name
Owned For
Owner Type
Purchase Details
Closed on
May 21, 2015
Sold by
Levitt Matthew
Bought by
K2 Investment Llc
Current Estimated Value
Purchase Details
Closed on
Feb 10, 2011
Sold by
Fannie Mae
Bought by
Levitt Matthew
Purchase Details
Closed on
Nov 4, 2010
Sold by
Bloxham Craig W
Bought by
Federal National Mortgage Association
Purchase Details
Closed on
Mar 30, 2005
Sold by
Duarte Dee Alex and Duarte Judy J
Bought by
Bloxham Craig W
Home Financials for this Owner
Home Financials are based on the most recent Mortgage that was taken out on this home.
Original Mortgage
$123,000
Interest Rate
5.84%
Mortgage Type
Fannie Mae Freddie Mac
Purchase Details
Closed on
Feb 11, 2004
Sold by
Rashmajian Robin Ann
Bought by
Duarte Dee Alex and Duarte Judy J
Create a Home Valuation Report for This Property
The Home Valuation Report is an in-depth analysis detailing your home's value as well as a comparison with similar homes in the area
Home Values in the Area
Average Home Value in this Area
Purchase History
| Date | Buyer | Sale Price | Title Company |
|---|---|---|---|
| K2 Investment Llc | $53,000 | Western Title Co | |
| Levitt Matthew | -- | Western Title Co | |
| Levitt Matthew | $25,500 | Ticor Title Reno | |
| Federal National Mortgage Association | $22,000 | Pasion Title Services | |
| Bloxham Craig W | $123,000 | First Centennial Title Co | |
| Duarte Dee Alex | $57,000 | First Centennial Title Compa |
Source: Public Records
Mortgage History
| Date | Status | Borrower | Loan Amount |
|---|---|---|---|
| Previous Owner | Bloxham Craig W | $123,000 |
Source: Public Records
Tax History Compared to Growth
Tax History
| Year | Tax Paid | Tax Assessment Tax Assessment Total Assessment is a certain percentage of the fair market value that is determined by local assessors to be the total taxable value of land and additions on the property. | Land | Improvement |
|---|---|---|---|---|
| 2025 | $394 | $28,118 | $16,765 | $11,353 |
| 2024 | $394 | $27,803 | $15,750 | $12,053 |
| 2023 | $383 | $25,517 | $14,665 | $10,852 |
| 2022 | $370 | $21,274 | $11,690 | $9,584 |
| 2021 | $361 | $19,380 | $9,625 | $9,755 |
| 2020 | $347 | $17,814 | $7,735 | $10,079 |
| 2019 | $336 | $16,761 | $6,825 | $9,936 |
| 2018 | $327 | $14,009 | $4,095 | $9,914 |
| 2017 | $319 | $13,169 | $3,150 | $10,019 |
| 2016 | $312 | $13,000 | $2,590 | $10,410 |
| 2015 | $311 | $13,364 | $2,555 | $10,809 |
| 2014 | $302 | $12,582 | $2,135 | $10,447 |
| 2013 | -- | $8,001 | $1,050 | $6,951 |
Source: Public Records
Map
Nearby Homes
- 4602 Neil Rd Unit 58
- 4600 Neil Rd Unit 35
- 4600 Neil Rd Unit 33
- 4604 Neil Rd Unit 141
- 4604 Neil Rd Unit 142
- 4608 Neil Rd Unit 226
- 4608 Neil Rd Unit 241
- 4571 Aster Dr
- 4 Smithridge Park
- 1465 E Peckham Ln Unit 40
- 1465 E Peckham Ln Unit 53
- 1465 E Peckham Ln Unit 55
- 28 Smithridge Park
- 165 Smithridge Park
- 4941 Catalina Dr Unit 2
- 528 Smithridge Park Unit 528
- 5010 Tahiti Way Unit 2
- 5030 Tahiti Way Unit 4
- 268 Smithridge Park Unit 2
- 5030 Neil Rd Unit 2
- 4602 Neil Rd Unit 65
- 4602 Neil Rd
- 4602 Neil Rd Unit 84
- 4602 Neil Rd Unit 70
- 4602 Neil Rd Unit 81
- 4602 Neil Rd Unit 95
- 4602 Neil Rd Unit Building 16, 66
- 4602 Neil Rd Unit 66
- 4602 Neil Rd Unit 85
- 4602 Neil Rd Unit 82 Bldg 22
- 4602 Neil Rd Unit 75
- 4602 Neil Rd Unit 72
- 4602 Neil Rd
- 4602 Neil Rd Unit 187
- 4602 Neil Rd Unit 185
- 4602 Neil Rd
- 4602 Neil Rd Unit 141
- 4602 Neil Rd Unit 139
- 4602 Neil Rd Unit 147
- 4602 Neil Rd