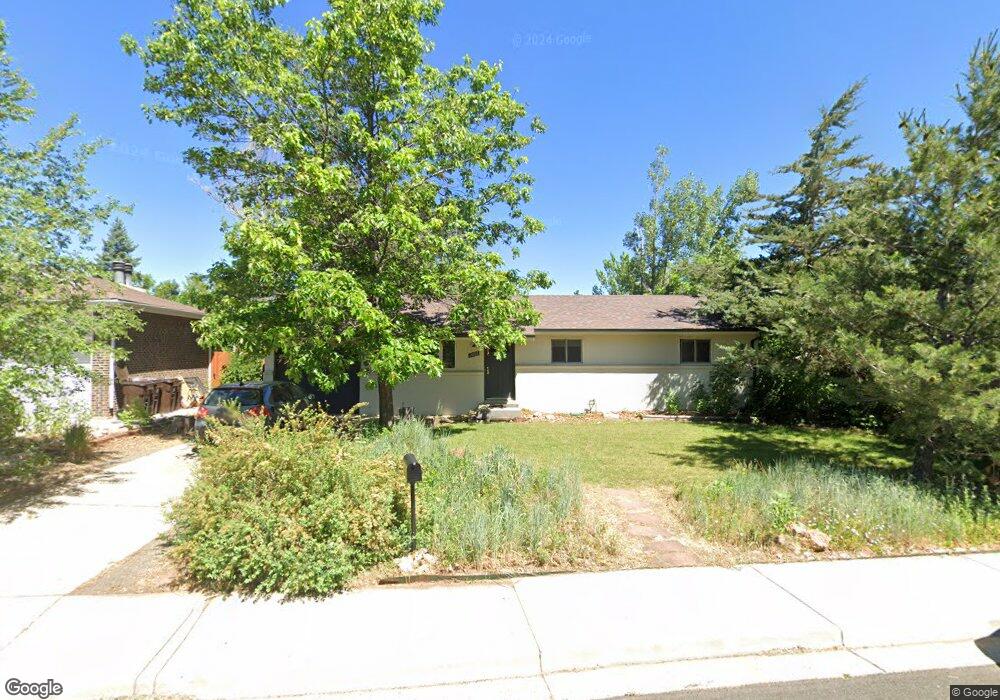
4605 MacKy Way Boulder, CO 80305
South Boulder NeighborhoodEstimated Value: $810,000 - $1,070,000
3
Beds
2
Baths
1,092
Sq Ft
$849/Sq Ft
Est. Value
About This Home
This home is located at 4605 MacKy Way, Boulder, CO 80305 and is currently estimated at $927,478, approximately $849 per square foot. 4605 MacKy Way is a home located in Boulder County with nearby schools including Creekside Elementary School, Southern Hills Middle School, and Fairview High School.
Ownership History
Date
Name
Owned For
Owner Type
Purchase Details
Closed on
Jul 17, 2006
Sold by
Cartus Financial Corp
Bought by
Nuernberger Christopher Peter
Current Estimated Value
Home Financials for this Owner
Home Financials are based on the most recent Mortgage that was taken out on this home.
Original Mortgage
$256,000
Outstanding Balance
$148,598
Interest Rate
6.25%
Mortgage Type
Unknown
Estimated Equity
$778,880
Purchase Details
Closed on
Jun 1, 2006
Sold by
Hagadorn John R and Kincaid Karen
Bought by
Cartus Financial Corp
Home Financials for this Owner
Home Financials are based on the most recent Mortgage that was taken out on this home.
Original Mortgage
$256,000
Outstanding Balance
$148,598
Interest Rate
6.25%
Mortgage Type
Unknown
Estimated Equity
$778,880
Purchase Details
Closed on
Feb 28, 2001
Sold by
Taft James B and Taft Jane G
Bought by
Hagadorn John R
Home Financials for this Owner
Home Financials are based on the most recent Mortgage that was taken out on this home.
Original Mortgage
$197,600
Interest Rate
6.97%
Purchase Details
Closed on
Apr 29, 1977
Bought by
Nuernberger Christopher Peter
Create a Home Valuation Report for This Property
The Home Valuation Report is an in-depth analysis detailing your home's value as well as a comparison with similar homes in the area
Home Values in the Area
Average Home Value in this Area
Purchase History
| Date | Buyer | Sale Price | Title Company |
|---|---|---|---|
| Nuernberger Christopher Peter | $320,000 | Guardian Title | |
| Cartus Financial Corp | $320,000 | Guardian Title | |
| Hagadorn John R | $247,000 | -- | |
| Nuernberger Christopher Peter | $45,000 | -- |
Source: Public Records
Mortgage History
| Date | Status | Borrower | Loan Amount |
|---|---|---|---|
| Open | Nuernberger Christopher Peter | $256,000 | |
| Previous Owner | Cartus Financial Corp | $48,000 | |
| Previous Owner | Hagadorn John R | $197,600 |
Source: Public Records
Tax History
| Year | Tax Paid | Tax Assessment Tax Assessment Total Assessment is a certain percentage of the fair market value that is determined by local assessors to be the total taxable value of land and additions on the property. | Land | Improvement |
|---|---|---|---|---|
| 2025 | $4,542 | $47,213 | $29,694 | $17,519 |
| 2024 | $4,542 | $47,213 | $29,694 | $17,519 |
| 2023 | $4,461 | $50,786 | $35,088 | $19,383 |
| 2022 | $4,002 | $42,291 | $26,125 | $16,166 |
| 2021 | $3,820 | $43,508 | $26,877 | $16,631 |
| 2020 | $3,688 | $42,364 | $25,383 | $16,981 |
| 2019 | $3,631 | $42,364 | $25,383 | $16,981 |
| 2018 | $3,342 | $38,542 | $23,400 | $15,142 |
| 2017 | $3,237 | $42,610 | $25,870 | $16,740 |
| 2016 | $3,057 | $35,310 | $16,238 | $19,072 |
| 2015 | $2,894 | $27,518 | $10,587 | $16,931 |
| 2014 | $2,314 | $27,518 | $10,587 | $16,931 |
Source: Public Records
Map
Nearby Homes
- 4630 MacKy Way
- 4380 Ludlow St
- 1596 Bradley Dr Unit 105C
- 4445 Squires Cir
- 4286 Greenbriar Blvd
- 4204 Greenbriar Blvd Unit 45
- 860 W Moorhead Cir Unit 2K
- 860 W Moorhead Cir Unit 1I
- 860 W Moorhead Cir Unit 2H
- 800 W Moorhead Cir Unit E
- 1720 S Marshall Rd Unit 41
- 1720 S Marshall Rd Unit 26
- 750 W Moorhead Cir Unit A
- 755 W Moorhead Cir Unit B
- 725 S 45th St
- 4763 Tantra Dr Unit B
- 3970 Longwood Ave
- 3490 Emerson Ave
- 3450 Emerson Ave
- 3755 Silver Plume Ln
- 4615 MacKy Way
- 4601 MacKy Way
- 1240 Aikins Way
- 1236 Aikins Way
- 0 Aikins Way
- 1246 Aikins Way
- 4625 MacKy Way
- 4610 MacKy Way
- 4600 MacKy Way
- 4620 MacKy Way
- 1230 Aikins Way
- 4635 MacKy Way
- 1226 Aikins Way
- 1237 Aikins Way
- 1271 Aikins Way
- 1243 Aikins Way
- 1260 Aikins Way
- 1277 Aikins Way
- 1233 Aikins Way
- 1247 Aikins Way
Your Personal Tour Guide
Ask me questions while you tour the home.