
Landlord's Agent in 2025
Steven Gravlin
Thrive Real Estate Group
(720) 201-0266
1 in this area
46 Total Sales
Estimated Value: $588,000 - $707,000
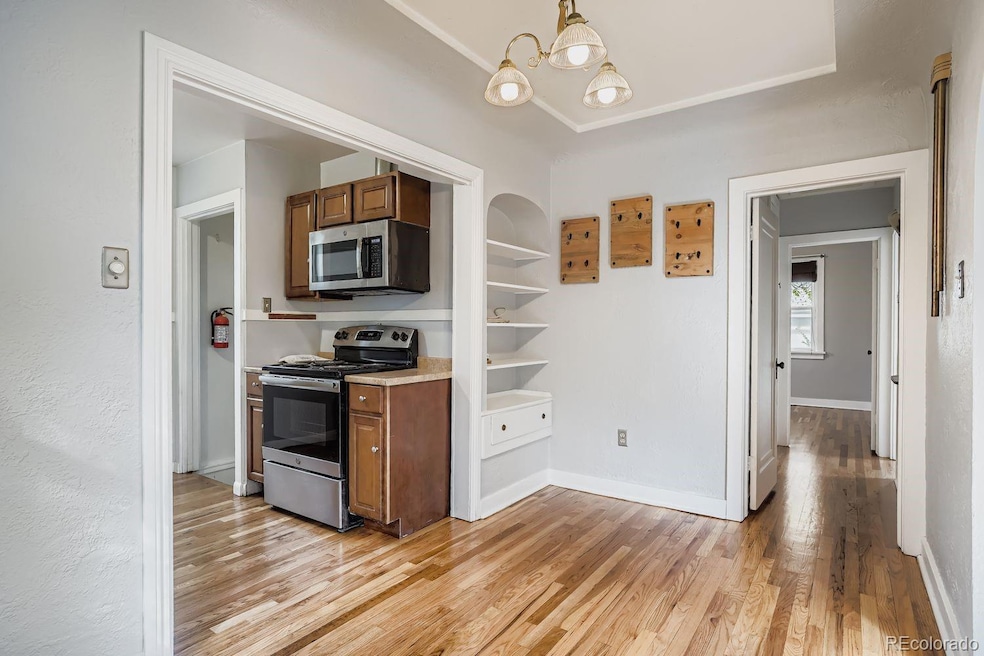
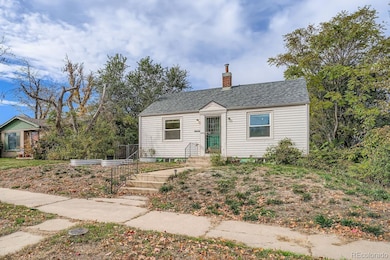
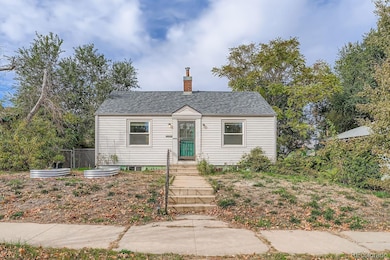
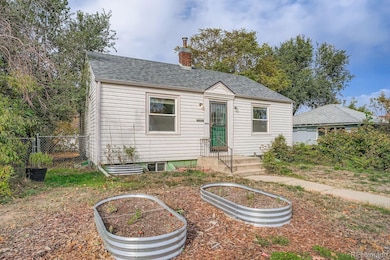
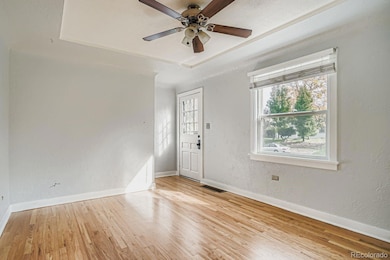
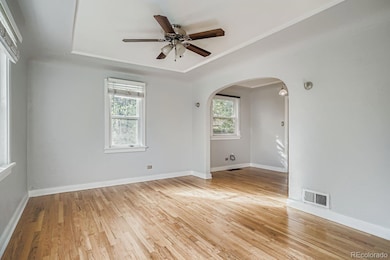
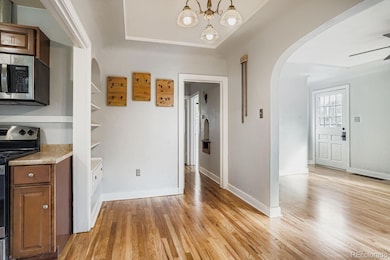
Roomy Berkeley House near Tennyson Business District. This property is in a spectacular North Highlands location, walking distance to to Tennyson Street Arts and Business District. Minutes from downtown, with easy access to highways. Home features three bedrooms and two baths. The main bathroom is equipped with a custom shower. Freshly refinished hardwood Floors, fenced yard, garage, two driveway parking spaces with an attached garage for storage. Application requirements: Credit report, Background check: $25. Interested applicants please apply here:
Last Agent to Rent the Property
Thrive Real Estate Group Brokerage Email: steven@thrivedenver.com,720-201-0266 License #100076140 Listed on: 11/04/2025
Last Renter's Agent
Thrive Real Estate Group Brokerage Email: steven@thrivedenver.com,720-201-0266 License #100076140 Listed on: 11/04/2025
| Date | Buyer | Sale Price | Title Company |
|---|---|---|---|
| Sethna Rohinton | $230,000 | -- | |
| Winch Kimberly A | $86,000 | Land Title | |
| Corey David Todd | $72,500 | First American Heritage Titl |
| Date | Status | Borrower | Loan Amount |
|---|---|---|---|
| Open | Sethna Rohinton | $112,500 | |
| Previous Owner | Winch Kimberly A | $85,685 | |
| Previous Owner | Corey David Todd | $68,875 | |
| Closed | Winch Kimberly A | $3,600 |
| Date | Event | Price | List to Sale | Price per Sq Ft |
|---|---|---|---|---|
| 12/27/2025 12/27/25 | Rented | $2,600 | 0.0% | -- |
| 11/04/2025 11/04/25 | For Rent | $2,600 | -- | -- |
| Year | Tax Paid | Tax Assessment Tax Assessment Total Assessment is a certain percentage of the fair market value that is determined by local assessors to be the total taxable value of land and additions on the property. | Land | Improvement |
|---|---|---|---|---|
| 2025 | $3,347 | $48,460 | $35,230 | $35,230 |
| 2024 | $3,347 | $42,260 | $29,790 | $12,470 |
| 2023 | $3,275 | $42,260 | $29,790 | $12,470 |
| 2022 | $2,740 | $34,460 | $30,390 | $4,070 |
| 2021 | $2,645 | $35,450 | $31,270 | $4,180 |
| 2020 | $2,319 | $31,250 | $26,800 | $4,450 |
| 2019 | $2,254 | $31,250 | $26,800 | $4,450 |
| 2018 | $2,188 | $28,280 | $20,240 | $8,040 |
| 2017 | $2,181 | $28,280 | $20,240 | $8,040 |
| 2016 | $1,995 | $24,460 | $19,892 | $4,568 |
| 2015 | $1,911 | $24,460 | $19,892 | $4,568 |
| 2014 | $1,586 | $19,090 | $14,917 | $4,173 |
Landlord's Agent in 2025
Steven Gravlin
Thrive Real Estate Group
(720) 201-0266
1 in this area
46 Total Sales
Source: REcolorado®
MLS Number: 3542694
APN: 2191-08-014
Disclaimer: Certain information contained herein is derived from information provided by parties other than Homes.com. All information provided is deemed reliable, but is not guaranteed to be accurate and should be independently verified.
![]() The content relating to real estate for sale in this Web site comes in part from the Internet Data eXchange (“IDX”) program of METROLIST, INC., DBA RECOLORADO®. Real estate listings held by brokers other than Ten-X are marked with the IDX Logo. This information is being provided for the consumers’ personal, non-commercial use and may not be used for any other purpose. All information subject to change and should be independently verified.
The content relating to real estate for sale in this Web site comes in part from the Internet Data eXchange (“IDX”) program of METROLIST, INC., DBA RECOLORADO®. Real estate listings held by brokers other than Ten-X are marked with the IDX Logo. This information is being provided for the consumers’ personal, non-commercial use and may not be used for any other purpose. All information subject to change and should be independently verified.
This publication is designed to provide information with regard to the subject matter covered. It is displayed with the understanding that the publisher and authors are not engaged in rendering real estate, legal, accounting, tax, or other professional services and that the publisher and authors are not offering such advice in this publication. If real estate, legal, or other expert assistance is required, the services of a competent, professional person should be sought.
The information contained in this publication is subject to change without notice. METROLIST, INC., DBA RECOLORADO MAKES NO WARRANTY OF ANY KIND WITH REGARD TO THIS MATERIAL, INCLUDING, BUT NOT LIMITED TO, THE IMPLIED WARRANTIES OF MERCHANTABILITY AND FITNESS FOR A PARTICULAR PURPOSE. METROLIST, INC., DBA RECOLORADO SHALL NOT BE LIABLE FOR ERRORS CONTAINED HEREIN OR FOR ANY DAMAGES IN CONNECTION WITH THE FURNISHING, PERFORMANCE, OR USE OF THIS MATERIAL.
PUBLISHER’S NOTICE: All real estate advertised herein is subject to the Federal Fair Housing Act and the Colorado Fair Housing Act, which Acts make it illegal to make or publish any advertisement that indicates any preference, limitation, or discrimination based on race, color, religion, sex, handicap, familial status, or national origin.
METROLIST, INC., DBA RECOLORADO will not knowingly accept any advertising for real estate that is in violation of the law. All persons are hereby informed that all dwellings advertised are available on an equal opportunity basis.
© 2025 METROLIST, INC., DBA RECOLORADO® – All Rights Reserved. 6455 S. Yosemite St., Suite 500 Greenwood Village, CO 80111 USA
ALL RIGHTS RESERVED WORLDWIDE. No part of this publication may be reproduced, adapted, translated, stored in a retrieval system or transmitted in any form or by any means, electronic, mechanical, photocopying, recording, or otherwise, without the prior written permission of the publisher. The information contained herein including but not limited to all text, photographs, digital images, virtual tours, may be seeded and monitored for protection and tracking.