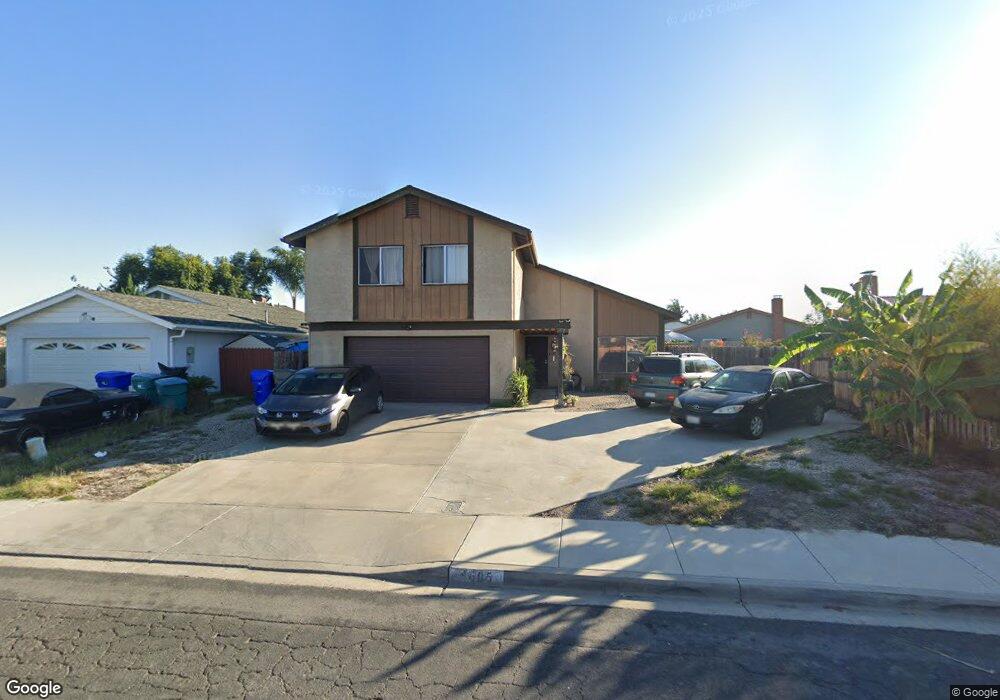
4605 Vinyard St Oceanside, CA 92057
North Valley NeighborhoodEstimated Value: $638,000 - $839,000
4
Beds
3
Baths
1,666
Sq Ft
$463/Sq Ft
Est. Value
About This Home
This home is located at 4605 Vinyard St, Oceanside, CA 92057 and is currently estimated at $771,480, approximately $463 per square foot. 4605 Vinyard St is a home located in San Diego County with nearby schools including Reynolds Elementary School, Martin Luther King Jr. Middle School, and El Camino High School.
Ownership History
Date
Name
Owned For
Owner Type
Purchase Details
Closed on
Jan 10, 2006
Sold by
Phillips Stewart
Bought by
Pacific Vinyards Trust
Current Estimated Value
Purchase Details
Closed on
Dec 6, 2005
Sold by
Phillips Luz
Bought by
Phillips Stewart
Purchase Details
Closed on
Jun 13, 2002
Sold by
Curry Thomas M
Bought by
Phillips Stewart
Home Financials for this Owner
Home Financials are based on the most recent Mortgage that was taken out on this home.
Original Mortgage
$153,000
Interest Rate
6.7%
Purchase Details
Closed on
Aug 4, 1994
Sold by
Curry Naeko A
Bought by
Curry Thomas M
Home Financials for this Owner
Home Financials are based on the most recent Mortgage that was taken out on this home.
Original Mortgage
$139,740
Interest Rate
8.65%
Mortgage Type
VA
Purchase Details
Closed on
Jul 22, 1994
Sold by
Miranda Antonio and Miranda Guadalupe C
Bought by
Curry Thomas M
Home Financials for this Owner
Home Financials are based on the most recent Mortgage that was taken out on this home.
Original Mortgage
$139,740
Interest Rate
8.65%
Mortgage Type
VA
Purchase Details
Closed on
Sep 28, 1988
Create a Home Valuation Report for This Property
The Home Valuation Report is an in-depth analysis detailing your home's value as well as a comparison with similar homes in the area
Home Values in the Area
Average Home Value in this Area
Purchase History
| Date | Buyer | Sale Price | Title Company |
|---|---|---|---|
| Pacific Vinyards Trust | -- | -- | |
| Phillips Stewart | -- | United Title | |
| Phillips Stewart | -- | United Title | |
| Phillips Stewart | $191,500 | American Title Ins Co | |
| Curry Thomas M | -- | South Coast Title Co | |
| Curry Thomas M | $137,000 | South Coast Title Co | |
| -- | $126,500 | -- |
Source: Public Records
Mortgage History
| Date | Status | Borrower | Loan Amount |
|---|---|---|---|
| Previous Owner | Phillips Stewart | $153,000 | |
| Previous Owner | Curry Thomas M | $139,740 |
Source: Public Records
Tax History Compared to Growth
Tax History
| Year | Tax Paid | Tax Assessment Tax Assessment Total Assessment is a certain percentage of the fair market value that is determined by local assessors to be the total taxable value of land and additions on the property. | Land | Improvement |
|---|---|---|---|---|
| 2025 | $2,573 | $230,080 | $63,649 | $166,431 |
| 2024 | $2,573 | $225,569 | $62,401 | $163,168 |
| 2023 | $2,494 | $221,147 | $61,178 | $159,969 |
| 2022 | $2,456 | $216,812 | $59,979 | $156,833 |
| 2021 | $2,466 | $212,561 | $58,803 | $153,758 |
| 2020 | $2,391 | $210,383 | $58,201 | $152,182 |
| 2019 | $2,322 | $206,259 | $57,060 | $149,199 |
| 2018 | $2,298 | $202,216 | $55,942 | $146,274 |
| 2017 | $2,256 | $198,252 | $54,846 | $143,406 |
| 2016 | $2,182 | $194,366 | $53,771 | $140,595 |
| 2015 | $2,120 | $191,448 | $52,964 | $138,484 |
| 2014 | $2,039 | $187,699 | $51,927 | $135,772 |
Source: Public Records
Map
Nearby Homes
- 213 Festival Dr
- 4616 N River Rd Unit 61
- 194 Avenida Descanso Unit H
- 4418 Jill St
- 195 Avenida Descanso Unit 121
- 4556 Mariners Bay
- 231 Riverview Way
- 4466 Saint Andrews Place
- 4660 N River Rd Unit 116
- 4660 N River Rd Unit 17
- 4660 N River Rd Unit 150
- 0 N River Rd Unit NDP2507519
- 306 Trunks Bay
- 514 Calle Montecito Unit 78
- 517 Calle Montecito Unit 91
- 1 Calle Mariposa
- 4425 Arbor Cove Cir
- 4596 Coronado Dr
- 638 Sumner Way Unit 2
- 625 Sumner Way Unit 4
- 4601 Vinyard St
- 4609 Vinyard St
- 4596 Jamboree St
- 4592 Jamboree St
- 4598 Jamboree St
- 4597 Vinyard St
- 4588 Jamboree St
- 4604 Vinyard St
- 4608 Vinyard St
- 4600 Vinyard St
- 4593 Vinyard St
- 4584 Jamboree St
- 237 Holiday Way
- 239 Holiday Way
- 235 Holiday Way
- 4596 Vinyard St
- 241 Holiday Way
- 233 Holiday Way
- 243 Holiday Way
- 4580 Jamboree St