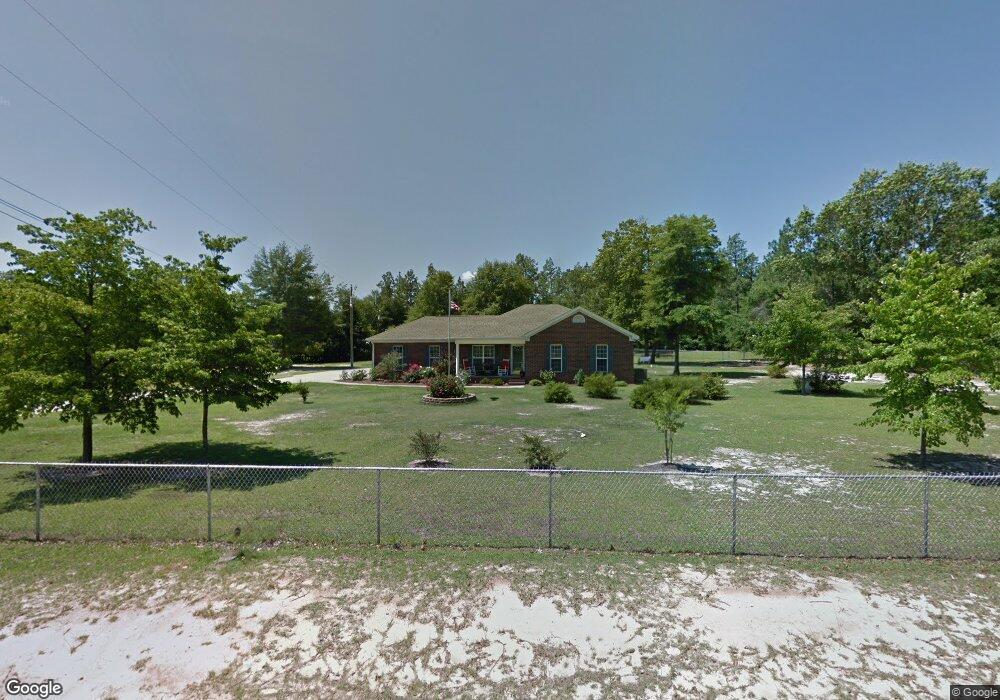
4606 Rollins Rd Augusta, GA 30906
McBean NeighborhoodEstimated Value: $181,000 - $214,859
3
Beds
2
Baths
1,284
Sq Ft
$159/Sq Ft
Est. Value
About This Home
This home is located at 4606 Rollins Rd, Augusta, GA 30906 and is currently estimated at $204,465, approximately $159 per square foot. 4606 Rollins Rd is a home located in Richmond County with nearby schools including McBean Elementary School, Pine Hill Middle School, and Johnson Magnet.
Ownership History
Date
Name
Owned For
Owner Type
Purchase Details
Closed on
Oct 10, 2025
Sold by
Carroll Lee Ellen
Bought by
Carroll Lee Ellen and Rhodes Steven Dale
Current Estimated Value
Purchase Details
Closed on
Nov 29, 2005
Sold by
Whitener Sarah J
Bought by
Carroll Lee Ellen
Purchase Details
Closed on
Jan 16, 2004
Sold by
Johnson Darryl D and Johnson Shannon M
Bought by
Whitener Sarah J
Home Financials for this Owner
Home Financials are based on the most recent Mortgage that was taken out on this home.
Original Mortgage
$20,615
Interest Rate
5.85%
Mortgage Type
Purchase Money Mortgage
Purchase Details
Closed on
Jan 29, 2003
Sold by
Rennison Thomas H and Rennison Kay
Bought by
Johnson Darryl D and Johnson Shannon M
Purchase Details
Closed on
Jan 8, 2002
Sold by
Newsome Norman L
Bought by
Rennison Thomas H and Rennison Kay
Purchase Details
Closed on
May 5, 1997
Sold by
Clifford Wilma L
Bought by
Clifford Wilma L
Purchase Details
Closed on
Jun 8, 1995
Sold by
Groover Elliott Groover Shirley Groove
Bought by
Clifford Wilma L
Create a Home Valuation Report for This Property
The Home Valuation Report is an in-depth analysis detailing your home's value as well as a comparison with similar homes in the area
Home Values in the Area
Average Home Value in this Area
Purchase History
| Date | Buyer | Sale Price | Title Company |
|---|---|---|---|
| Carroll Lee Ellen | -- | -- | |
| Carroll Lee Ellen | -- | -- | |
| Whitener Sarah J | $25,500 | -- | |
| Johnson Darryl D | $25,400 | -- | |
| Rennison Thomas H | $25,000 | -- | |
| Rennison Thomas H | -- | -- | |
| Clifford Wilma L | -- | -- | |
| Clifford Wilma L | -- | -- |
Source: Public Records
Mortgage History
| Date | Status | Borrower | Loan Amount |
|---|---|---|---|
| Previous Owner | Whitener Sarah J | $20,615 |
Source: Public Records
Tax History
| Year | Tax Paid | Tax Assessment Tax Assessment Total Assessment is a certain percentage of the fair market value that is determined by local assessors to be the total taxable value of land and additions on the property. | Land | Improvement |
|---|---|---|---|---|
| 2025 | $339 | $100,464 | $7,392 | $93,072 |
| 2024 | $339 | $88,148 | $7,392 | $80,756 |
| 2023 | $706 | $81,956 | $7,392 | $74,564 |
| 2022 | $883 | $72,750 | $7,392 | $65,358 |
| 2021 | $649 | $45,810 | $7,392 | $38,418 |
| 2020 | $653 | $45,810 | $7,392 | $38,418 |
| 2019 | $683 | $45,810 | $7,392 | $38,418 |
| 2018 | $686 | $45,810 | $7,392 | $38,418 |
| 2017 | $688 | $45,810 | $7,392 | $38,418 |
| 2016 | $688 | $45,810 | $7,392 | $38,418 |
| 2015 | $715 | $45,810 | $7,392 | $38,418 |
| 2014 | $766 | $45,810 | $7,392 | $38,418 |
Source: Public Records
Map
Nearby Homes
- 4684 Rollins Rd Unit 2
- 4684 Rollins Rd
- 4756 Mike Padgett Hwy
- 1049 Horseshoe Rd
- 1045 Horseshoe Rd
- 1029 Horseshoe B Rd
- 4546 Mike Padgett Hwy
- 979 Horseshoe Rd
- 1261 Alden Dr
- 1469 Clark Rd
- 5025 Mike Padgett Hwy
- 1131 Piney Grove Rd
- 1140 Piney Grove Rd
- 937 Bennock Mill Rd
- 1106B Hephzibah - McBean Rd
- 7042 Amarillo Cir
- 925 Hephzibah McBean Rd
- 1024 Hephzibah - McBean Rd
- 1233 Paramount Ct
- 1573 Oglethorpe Dr
- 4614 Rollins Rd
- 4690 Mike Padgett Hwy
- 4709 Mike Padgett Hwy
- 4680 Mike Padgett Hwy
- 4615 Rollins Rd
- 4717 Mike Padgett Hwy
- 4676 Mike Padgett Hwy
- 4674 Mike Padgett Hwy
- 4721 Mike Padgett Hwy
- 1199 Horseshoe Rd
- 4688 Mike Padgett Hwy
- 4617 Rollins Rd
- 4684 Mike Padgett
- 4684 Mike Padgett Hwy
- 1102 Union Cemetery Rd
- 4672 Mike Padgett Hwy
- 4632 Rollins Rd
- 1106 Union Cemetery Rd
- 4668 Mike Padgett Hwy
- 4634 Rollins Rd
Your Personal Tour Guide
Ask me questions while you tour the home.