
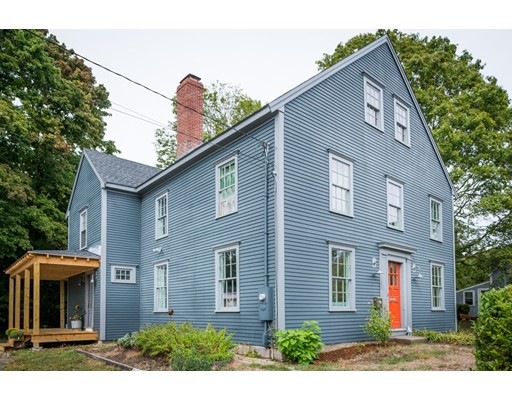
461 Main St Hingham, MA 02043
4
Beds
3
Baths
2,470
Sq Ft
8,712
Sq Ft Lot
About This Home
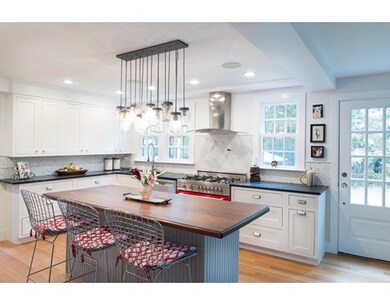
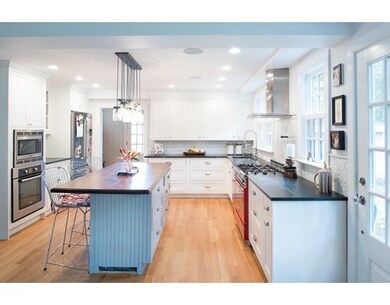
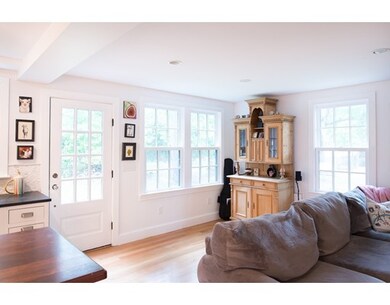
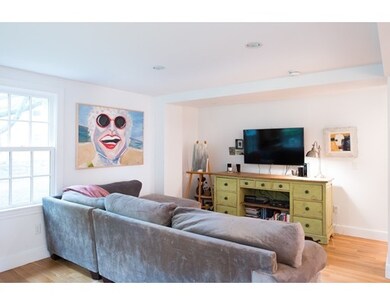
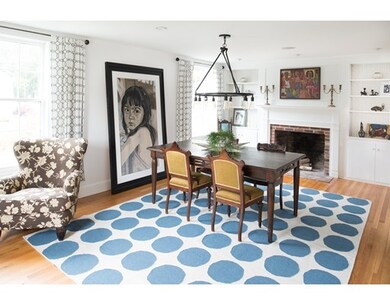
As of November 2018This beautiful setting is set back on Main Street near the park. The spacious living room has a fireplace and opens to the dining room. Property has newer upscale kitchen, four bedrooms, three baths, fireplace. Master Bath offers a sitting room, three closets, Jacuzzi and walk in shower. Spacious unfinished attic with walk- up stairs. Two car garage.
Last Agent to Sell the Property
Mary Donahue
Coldwell Banker Realty - Hingham License #449000246
Home Details
Home Type
- Single Family
Est. Annual Taxes
- $11,599
Year Built
- 1850
Utilities
- Sewer Inspection Required for Sale
Ownership History
Date
Name
Owned For
Owner Type
Purchase Details
Listed on
May 10, 2018
Closed on
Nov 13, 2018
Sold by
Kalish Matthew P and Kalish Ashley V
Bought by
Cederlund Rt
Seller's Agent
Alexis Lefort
Compass
Buyer's Agent
Non Member
Non Member Office
List Price
$999,000
Sold Price
$889,000
Premium/Discount to List
-$110,000
-11.01%
Total Days on Market
112
Current Estimated Value
Home Financials for this Owner
Home Financials are based on the most recent Mortgage that was taken out on this home.
Estimated Appreciation
$609,181
Avg. Annual Appreciation
8.32%
Purchase Details
Listed on
Oct 6, 2016
Closed on
Apr 27, 2017
Sold by
Calianos Jason C and Calianos Tara C
Bought by
Kalish Matthew P and Kalish Ashley V
Seller's Agent
Mary Donahue
Coldwell Banker Realty - Hingham
Buyer's Agent
Alice Pierce
Coldwell Banker Realty - Hingham
List Price
$849,000
Sold Price
$800,000
Premium/Discount to List
-$49,000
-5.77%
Home Financials for this Owner
Home Financials are based on the most recent Mortgage that was taken out on this home.
Avg. Annual Appreciation
7.04%
Original Mortgage
$640,000
Interest Rate
3.38%
Mortgage Type
Unknown
Map
Create a Home Valuation Report for This Property
The Home Valuation Report is an in-depth analysis detailing your home's value as well as a comparison with similar homes in the area
Similar Homes in the area
Home Values in the Area
Average Home Value in this Area
Purchase History
| Date | Type | Sale Price | Title Company |
|---|---|---|---|
| Not Resolvable | $889,000 | -- | |
| Not Resolvable | $800,000 | -- |
Source: Public Records
Mortgage History
| Date | Status | Loan Amount | Loan Type |
|---|---|---|---|
| Previous Owner | $640,000 | Unknown | |
| Previous Owner | $195,000 | No Value Available | |
| Previous Owner | $332,000 | No Value Available |
Source: Public Records
Property History
| Date | Event | Price | Change | Sq Ft Price |
|---|---|---|---|---|
| 11/13/2018 11/13/18 | Sold | $889,000 | -6.3% | $282 / Sq Ft |
| 09/06/2018 09/06/18 | Pending | -- | -- | -- |
| 09/01/2018 09/01/18 | Price Changed | $949,000 | -5.0% | $301 / Sq Ft |
| 08/08/2018 08/08/18 | Price Changed | $999,000 | 0.0% | $317 / Sq Ft |
| 08/08/2018 08/08/18 | For Sale | $999,000 | +12.4% | $317 / Sq Ft |
| 07/31/2018 07/31/18 | Off Market | $889,000 | -- | -- |
| 06/15/2018 06/15/18 | Price Changed | $1,099,000 | -7.6% | $348 / Sq Ft |
| 05/10/2018 05/10/18 | For Sale | $1,190,000 | +48.8% | $377 / Sq Ft |
| 04/27/2017 04/27/17 | Sold | $800,000 | -5.8% | $324 / Sq Ft |
| 01/26/2017 01/26/17 | Pending | -- | -- | -- |
| 10/06/2016 10/06/16 | For Sale | $849,000 | +81.2% | $344 / Sq Ft |
| 06/12/2012 06/12/12 | Sold | $468,500 | -8.1% | $234 / Sq Ft |
| 03/26/2012 03/26/12 | Pending | -- | -- | -- |
| 03/08/2012 03/08/12 | Price Changed | $510,000 | -3.8% | $255 / Sq Ft |
| 02/10/2012 02/10/12 | Price Changed | $530,000 | -3.6% | $265 / Sq Ft |
| 01/13/2012 01/13/12 | Price Changed | $549,900 | -2.7% | $275 / Sq Ft |
| 12/14/2011 12/14/11 | Price Changed | $564,900 | -2.6% | $282 / Sq Ft |
| 11/01/2011 11/01/11 | For Sale | $579,900 | -- | $290 / Sq Ft |
Source: MLS Property Information Network (MLS PIN)
Tax History
| Year | Tax Paid | Tax Assessment Tax Assessment Total Assessment is a certain percentage of the fair market value that is determined by local assessors to be the total taxable value of land and additions on the property. | Land | Improvement |
|---|---|---|---|---|
| 2025 | $11,599 | $1,085,000 | $442,400 | $642,600 |
| 2024 | $11,616 | $1,070,600 | $442,400 | $628,200 |
| 2023 | $10,506 | $1,050,600 | $442,400 | $608,200 |
| 2022 | $10,099 | $873,600 | $368,700 | $504,900 |
| 2021 | $10,071 | $853,500 | $368,700 | $484,800 |
| 2020 | $9,841 | $853,500 | $368,700 | $484,800 |
| 2019 | $9,018 | $763,600 | $368,700 | $394,900 |
| 2018 | $8,845 | $751,500 | $368,700 | $382,800 |
| 2017 | $7,076 | $577,600 | $350,100 | $227,500 |
| 2016 | $7,006 | $560,900 | $333,400 | $227,500 |
| 2015 | $6,830 | $545,100 | $317,600 | $227,500 |
Source: Public Records
Source: MLS Property Information Network (MLS PIN)
MLS Number: 72078009
APN: HING-000099-000000-000037
Disclaimer: Certain information contained herein is derived from information provided by parties other than Homes.com. All information provided is deemed reliable, but is not guaranteed to be accurate and should be independently verified.
![]() The property listing data and information, or the Images, set forth herein were provided to MLS Property Information Network, Inc. from third party sources, including sellers, lessors and public records, and were compiled by MLS Property Information Network, Inc. The property listing data and information, and the Images, are for the personal, non-commercial use of consumers having a good faith interest in purchasing or leasing listed properties of the type displayed to them and may not be used for any purpose other than to identify prospective properties which such consumers may have a good faith interest in purchasing or leasing. MLS Property Information Network, Inc. and its subscribers disclaim any and all representations and warranties as to the accuracy of the property listing data and information, or as to the accuracy of any of the Images, set forth herein.
The property listing data and information, or the Images, set forth herein were provided to MLS Property Information Network, Inc. from third party sources, including sellers, lessors and public records, and were compiled by MLS Property Information Network, Inc. The property listing data and information, and the Images, are for the personal, non-commercial use of consumers having a good faith interest in purchasing or leasing listed properties of the type displayed to them and may not be used for any purpose other than to identify prospective properties which such consumers may have a good faith interest in purchasing or leasing. MLS Property Information Network, Inc. and its subscribers disclaim any and all representations and warranties as to the accuracy of the property listing data and information, or as to the accuracy of any of the Images, set forth herein.
Nearby Homes