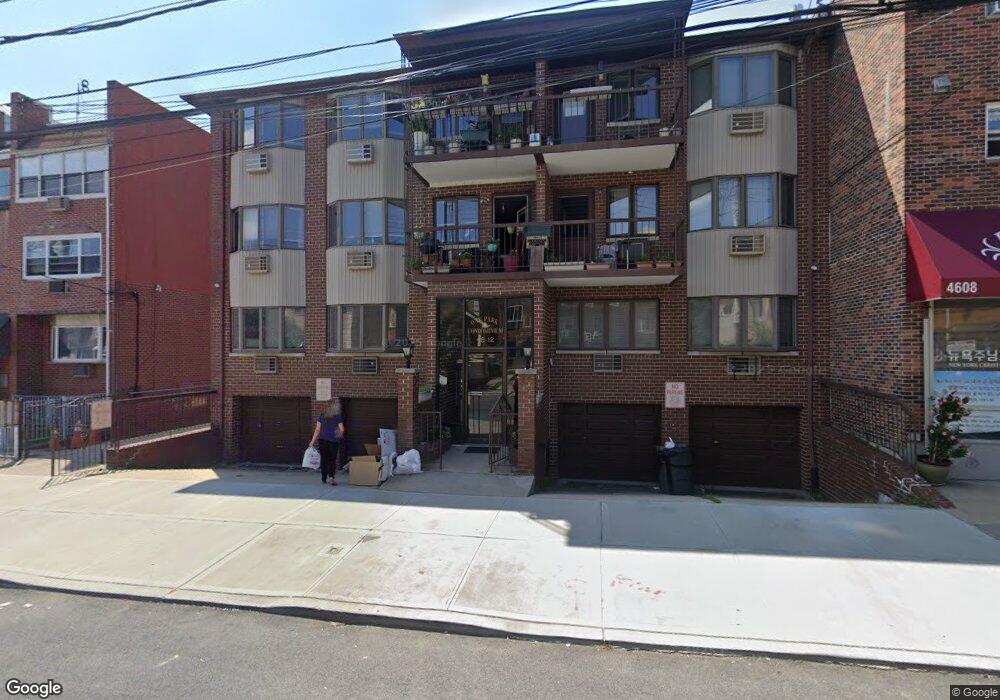
4612 161st St Unit 2D Flushing, NY 11358
Flushing NeighborhoodEstimated Value: $467,021 - $522,000
--
Bed
--
Bath
618
Sq Ft
$811/Sq Ft
Est. Value
About This Home
This home is located at 4612 161st St Unit 2D, Flushing, NY 11358 and is currently estimated at $501,005, approximately $810 per square foot. 4612 161st St Unit 2D is a home located in Queens County with nearby schools including Rachel Carson I.S. 237Q, Francis Lewis High School, and St. Andrew Avellino Catholic Academy.
Ownership History
Date
Name
Owned For
Owner Type
Purchase Details
Closed on
Jan 18, 2007
Sold by
Aminov Benjamin
Bought by
Hellins Barbara I
Current Estimated Value
Home Financials for this Owner
Home Financials are based on the most recent Mortgage that was taken out on this home.
Original Mortgage
$27,000
Outstanding Balance
$16,008
Interest Rate
6.16%
Estimated Equity
$484,997
Purchase Details
Closed on
May 23, 2005
Sold by
Nam Sang Bo
Bought by
Aminov Benjamin
Home Financials for this Owner
Home Financials are based on the most recent Mortgage that was taken out on this home.
Original Mortgage
$173,600
Interest Rate
5.83%
Mortgage Type
Purchase Money Mortgage
Purchase Details
Closed on
Feb 29, 2000
Sold by
Badalamente Frances
Bought by
Nam Sang Bo
Home Financials for this Owner
Home Financials are based on the most recent Mortgage that was taken out on this home.
Original Mortgage
$47,000
Interest Rate
8.24%
Create a Home Valuation Report for This Property
The Home Valuation Report is an in-depth analysis detailing your home's value as well as a comparison with similar homes in the area
Home Values in the Area
Average Home Value in this Area
Purchase History
| Date | Buyer | Sale Price | Title Company |
|---|---|---|---|
| Hellins Barbara I | $285,000 | -- | |
| Hellins Barbara I | $285,000 | -- | |
| Aminov Benjamin | $217,000 | -- | |
| Aminov Benjamin | $217,000 | -- | |
| Nam Sang Bo | $105,000 | Commonwealth Land Title Ins | |
| Nam Sang Bo | $105,000 | Commonwealth Land Title Ins |
Source: Public Records
Mortgage History
| Date | Status | Borrower | Loan Amount |
|---|---|---|---|
| Open | Hellins Barbara I | $27,000 | |
| Closed | Hellins Barbara I | $27,000 | |
| Open | Hellins Barbara I | $228,000 | |
| Closed | Hellins Barbara I | $228,000 | |
| Previous Owner | Aminov Benjamin | $173,600 | |
| Previous Owner | Nam Sang Bo | $47,000 |
Source: Public Records
Tax History Compared to Growth
Tax History
| Year | Tax Paid | Tax Assessment Tax Assessment Total Assessment is a certain percentage of the fair market value that is determined by local assessors to be the total taxable value of land and additions on the property. | Land | Improvement |
|---|---|---|---|---|
| 2025 | $2,956 | $16,238 | $41 | $16,197 |
| 2024 | $2,968 | $16,115 | $41 | $16,074 |
| 2023 | $2,772 | $15,203 | $36 | $15,167 |
| 2022 | $2,617 | $29,600 | $76 | $29,524 |
| 2021 | $2,552 | $25,741 | $76 | $25,665 |
| 2020 | $2,568 | $25,032 | $76 | $24,956 |
| 2019 | $2,516 | $21,764 | $76 | $21,688 |
| 2018 | $2,285 | $12,669 | $57 | $12,612 |
| 2017 | $2,137 | $11,953 | $55 | $11,898 |
| 2016 | $1,945 | $11,953 | $55 | $11,898 |
| 2015 | $1,140 | $11,277 | $59 | $11,218 |
| 2014 | $1,140 | $11,191 | $50 | $11,141 |
Source: Public Records
Map
Nearby Homes
- 46-12 161st St Unit 1D
- 46-12 161st St Unit 3B
- 4620 161st St Unit B2
- 45-57 160th St
- 46-05 158th St
- 162-19 Laburnum Ave
- 46-43 157th St
- 47-18 163rd St
- 45-14 161st St
- 45-35 163rd St
- 45-11 160th St
- 157-18 Laburnum Ave
- 45-57 157th St
- 45-11 157th St
- 157-51 Rose Ave
- 148-29 Laburnum Ave
- 4344 161st St
- 4547 166th St
- 148-24 Kalmia Ave
- 14824 Kalmia Ave
- 4612 161st St Unit 3D
- 4612 161st St Unit 3C
- 4612 161st St Unit 3B
- 4612 161st St Unit 3A
- 4612 161st St Unit 2C
- 4612 161st St Unit 2B
- 4612 161st St Unit 2A
- 4612 161st St Unit 1D
- 4612 161st St Unit 1C
- 4612 161st St Unit 1B
- 4612 161st St Unit 1A
- 4612 161st St
- 4612 161st St Unit P5
- 4612 161st St Unit P2
- 4612 161st St Unit P3
- 4612 161st St Unit G1
- 4612 161st St Unit P4
- 4612 161st St Unit G4
- 4612 161st St Unit P6
- 4612 161st St Unit G3